Schema Categories & Rich Results Performance
Overview
This section helps agencies understand how individual schema categories and rich results are performing on search engines. For multi-client or multi-site setups, it enables performance benchmarking across different schema implementations so agencies can prioritize optimizations and demonstrate ROI to clients.
Access this data through:
Path: MPC Dashboard > Schema > Performance Summary > Search Performance
Background & Flow
The Rich Results and Categories views offer two complementary insights:
1. Rich Results Performance
This view shows how rich results (like FAQs, events, breadcrumbs, etc.) are performing in search.
Metrics include:
- Total Impressions: How often your schema-enabled content was shown.
- Clicks: How often users clicked on those results.
- Average CTR: The click-through rate of the content.
- Average Position: The average ranking position of these rich results.
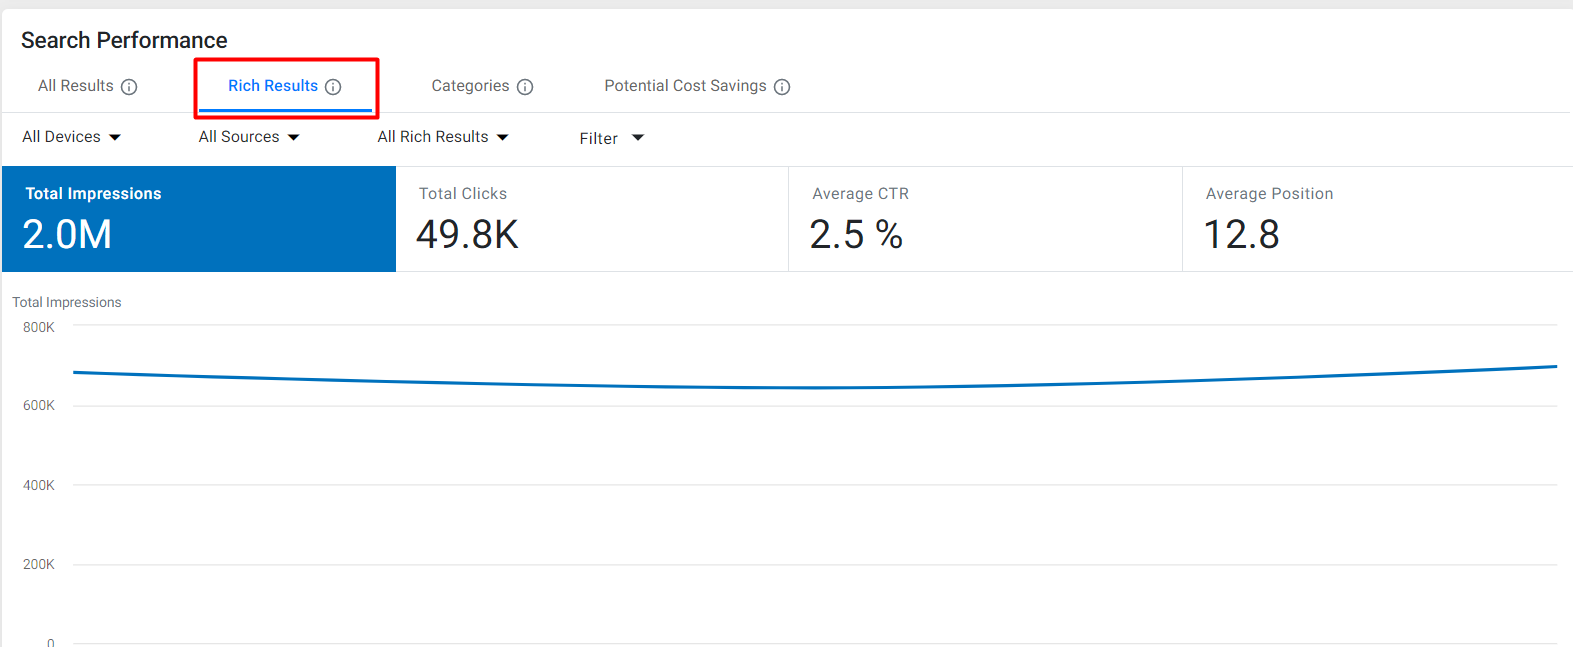
Clicking any KPI tile reveals its trend over time, helping identify growth or issues.
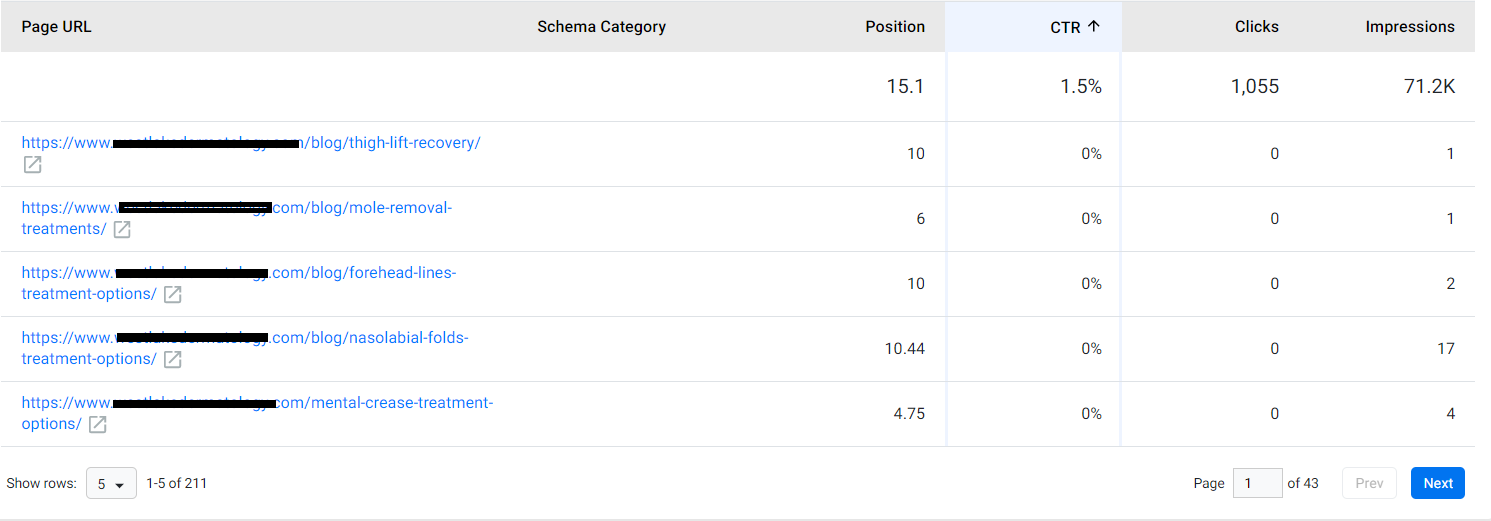
Each row in the table represents a unique URL that has published schema, offering a granular performance view.
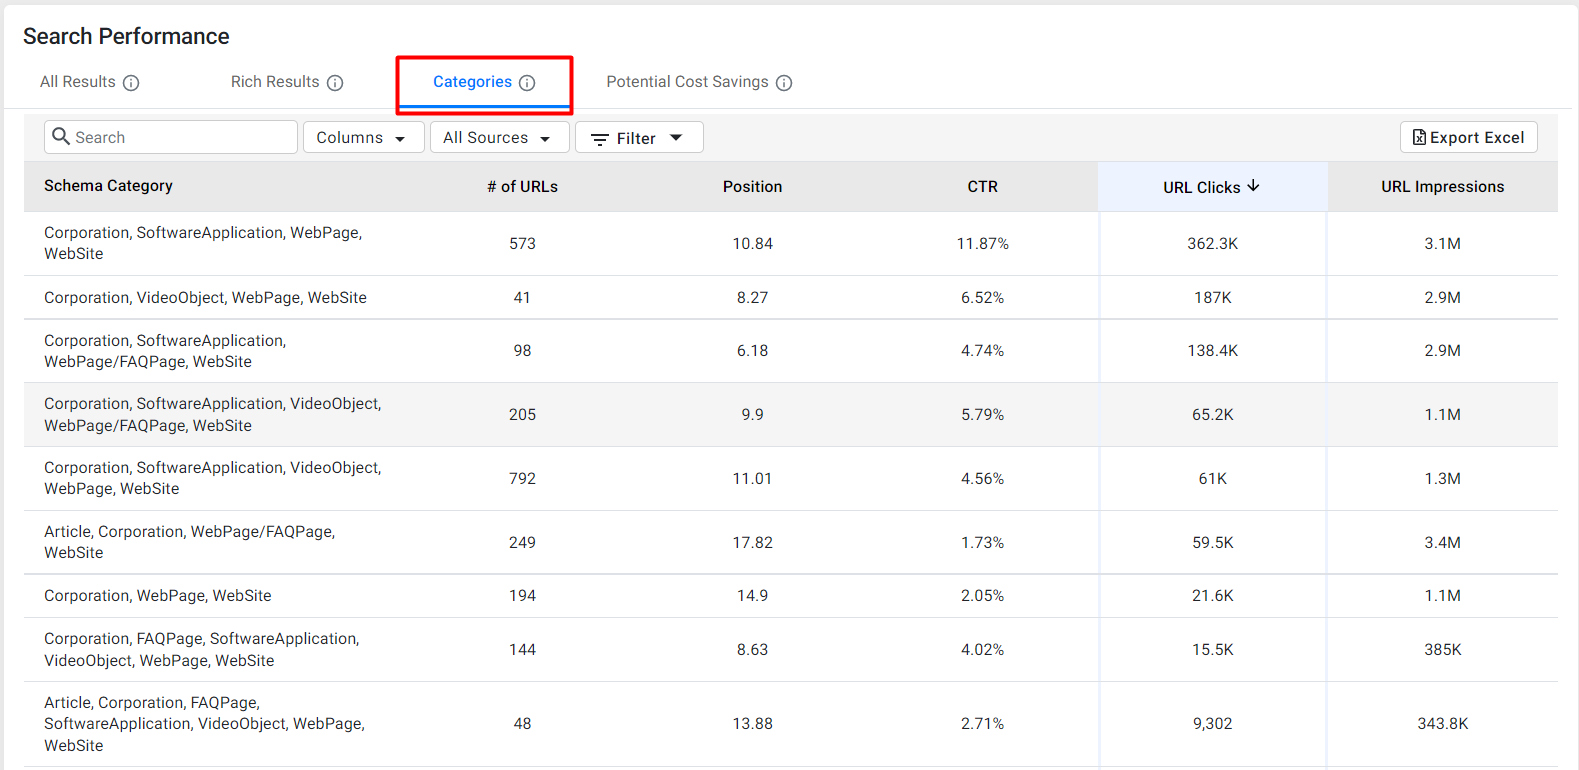
2. Schema Categories Performance
This view lets you track how each schema type or combination (e.g., FAQ + Product + Review) is performing.
You can evaluate performance by:
- CTR
- Search Position
- URL-level Clicks
- Impressions
This data helps agencies determine:
- Which schema combinations deliver the most visibility
- What schema needs to be fine-tuned or removed
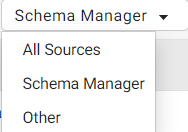
The source of data can be filtered to reflect either content from the Schema Manager or other sources.
Export functionality is available to generate detailed Excel reports for sharing with clients or internal teams.
Glossary of Terms
| Term | Definition |
|---|---|
| Rich Results | Enhanced listings in search results such as FAQs, breadcrumbs, and more. |
| Impressions | Number of times the schema-enabled URL appeared in search results. |
| Clicks | Number of times users clicked on the rich result. |
| CTR (Click-Through Rate) | Percentage of users who clicked after seeing the result. |
| Average Position | The average rank of a URL or result in search listings. |
| Schema Categories | Specific types or combinations of structured data tags applied to content. |
| Export Excel | Option to download performance data in spreadsheet format. |
Tips for Agency Success
- Use the Schema Categories tab to identify which schema types are working best across clients.
- Recommend schema adjustments based on underperforming combinations.
- Use exports to show clients ROI and improvement areas.
- Compare performance over time to track the impact of deployments or changes.
Audience Guidance
This article is most relevant to:
- SEO Leads and Analysts: Tracking schema performance across clients.
- Account Managers: Sharing visual performance updates and insights with stakeholders.
- Technical Implementers: Identifying which schema combinations should be refined.
- Strategists: Optimizing schema deployment strategy for maximum impact.
Ideal for use during:
- Quarterly business reviews
- Schema audits and refinements