Release Sep 9, 2024
CMS
Componentization – Forms
Path: CMS > Select Profile > Components
To enhance the user experience and support our componentization initiative, we have introduced the capability to use form components directly within Page Studio. This new feature provides users with a more streamlined and self-service experience, enabling them to efficiently add and manage forms as part of their page design process. The addition of form components is aimed at empowering users to have greater control and flexibility in creating dynamic and interactive web pages in Page Studio.
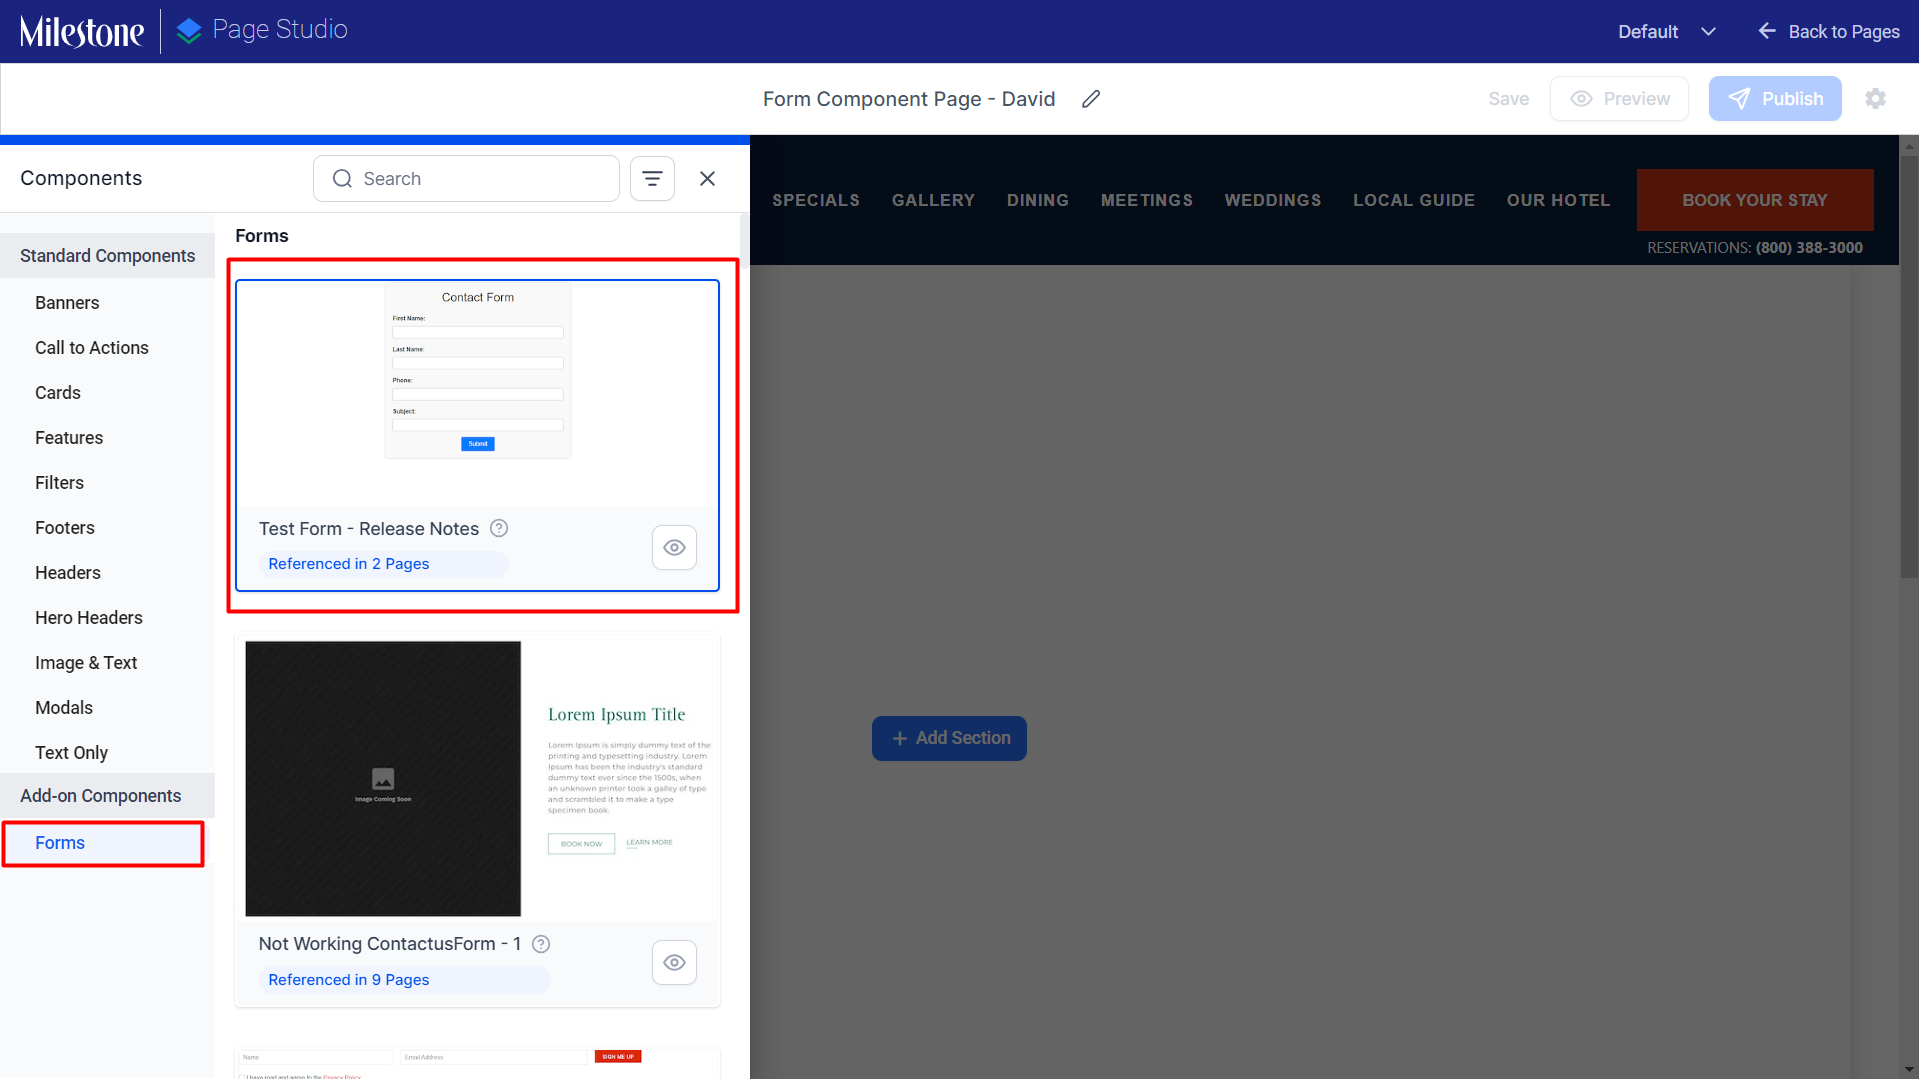
Forms that can be used on a page will be available under the ‘Add-on Components’ section in the Component Library.
Form Configuration
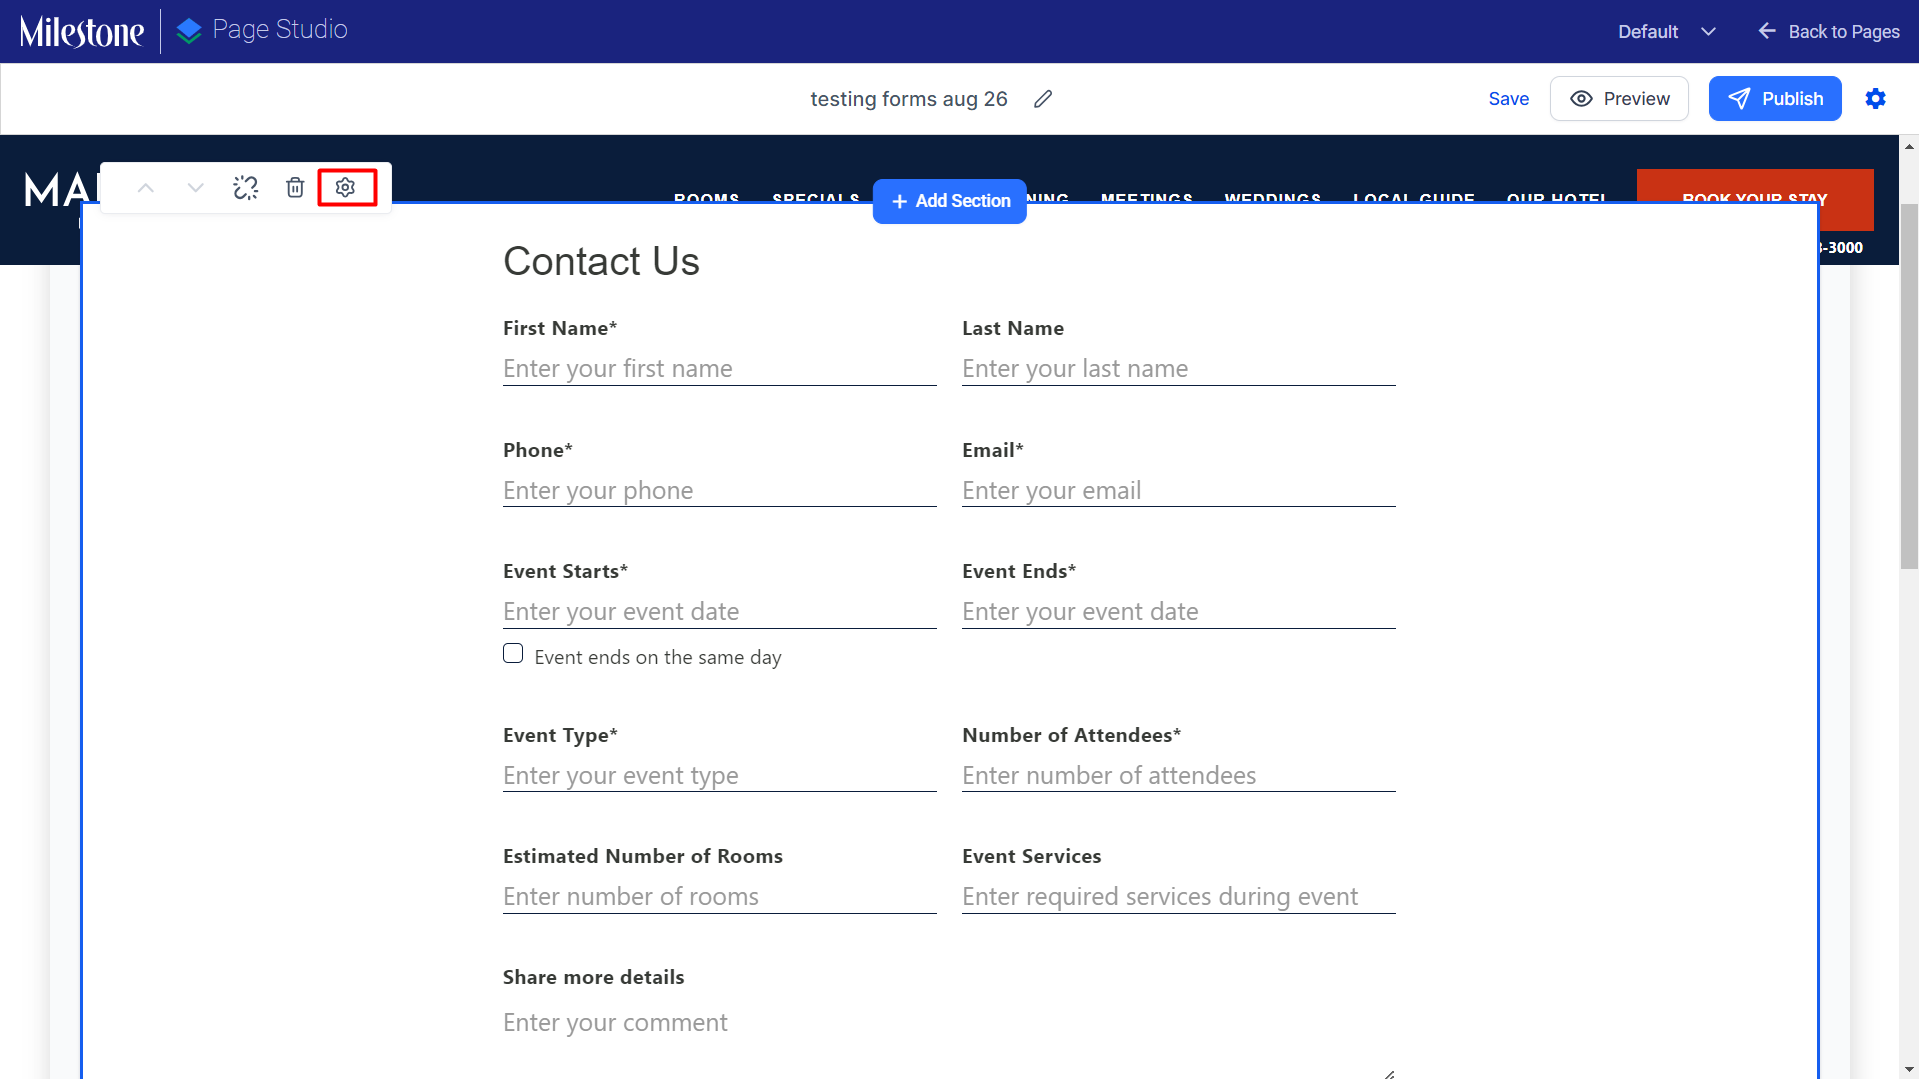
Once you have selected a form you can change the configuration of the form. The form configuration can be updated using the settings icon to the top of a form component on the page.
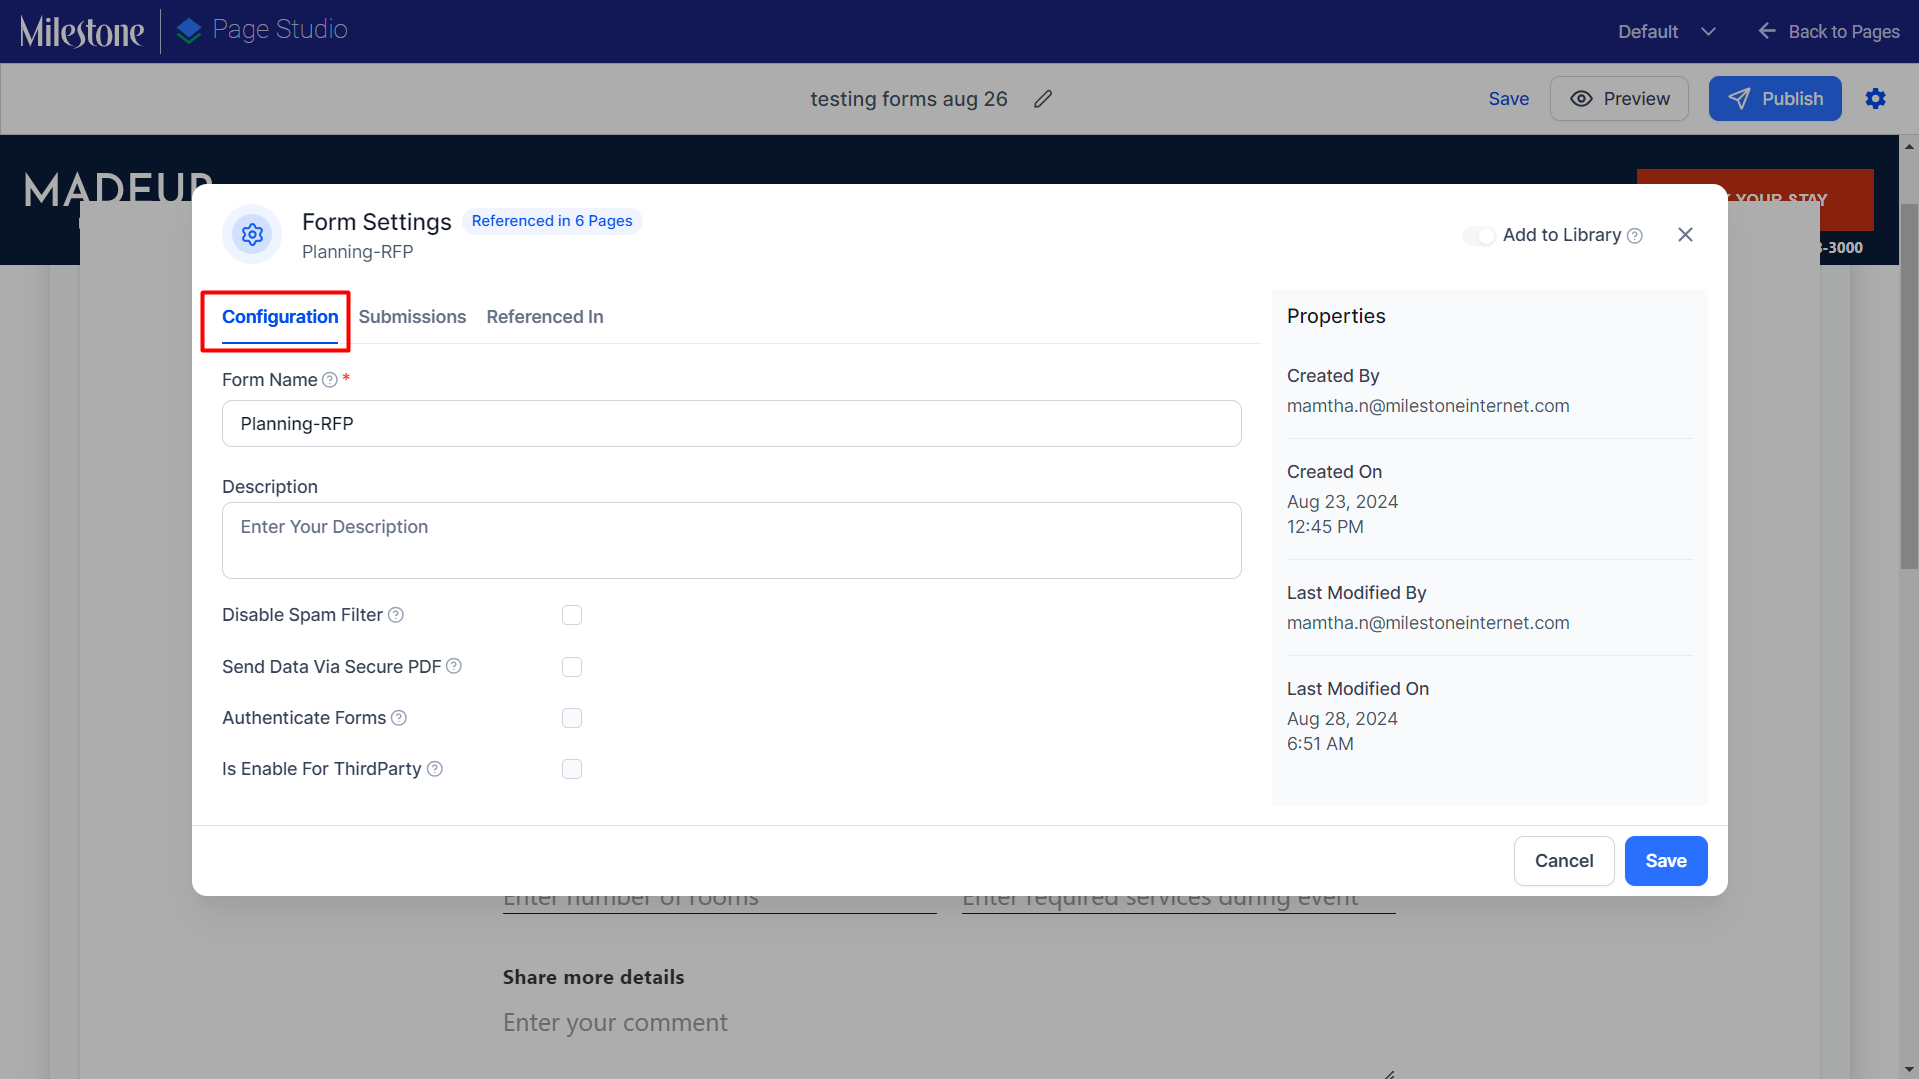
The configuration section allows you to update the form name, the description, enable or disable spam filters, send form data via secure PDFs, authenticate forms, and allow selected third parties to view form data.
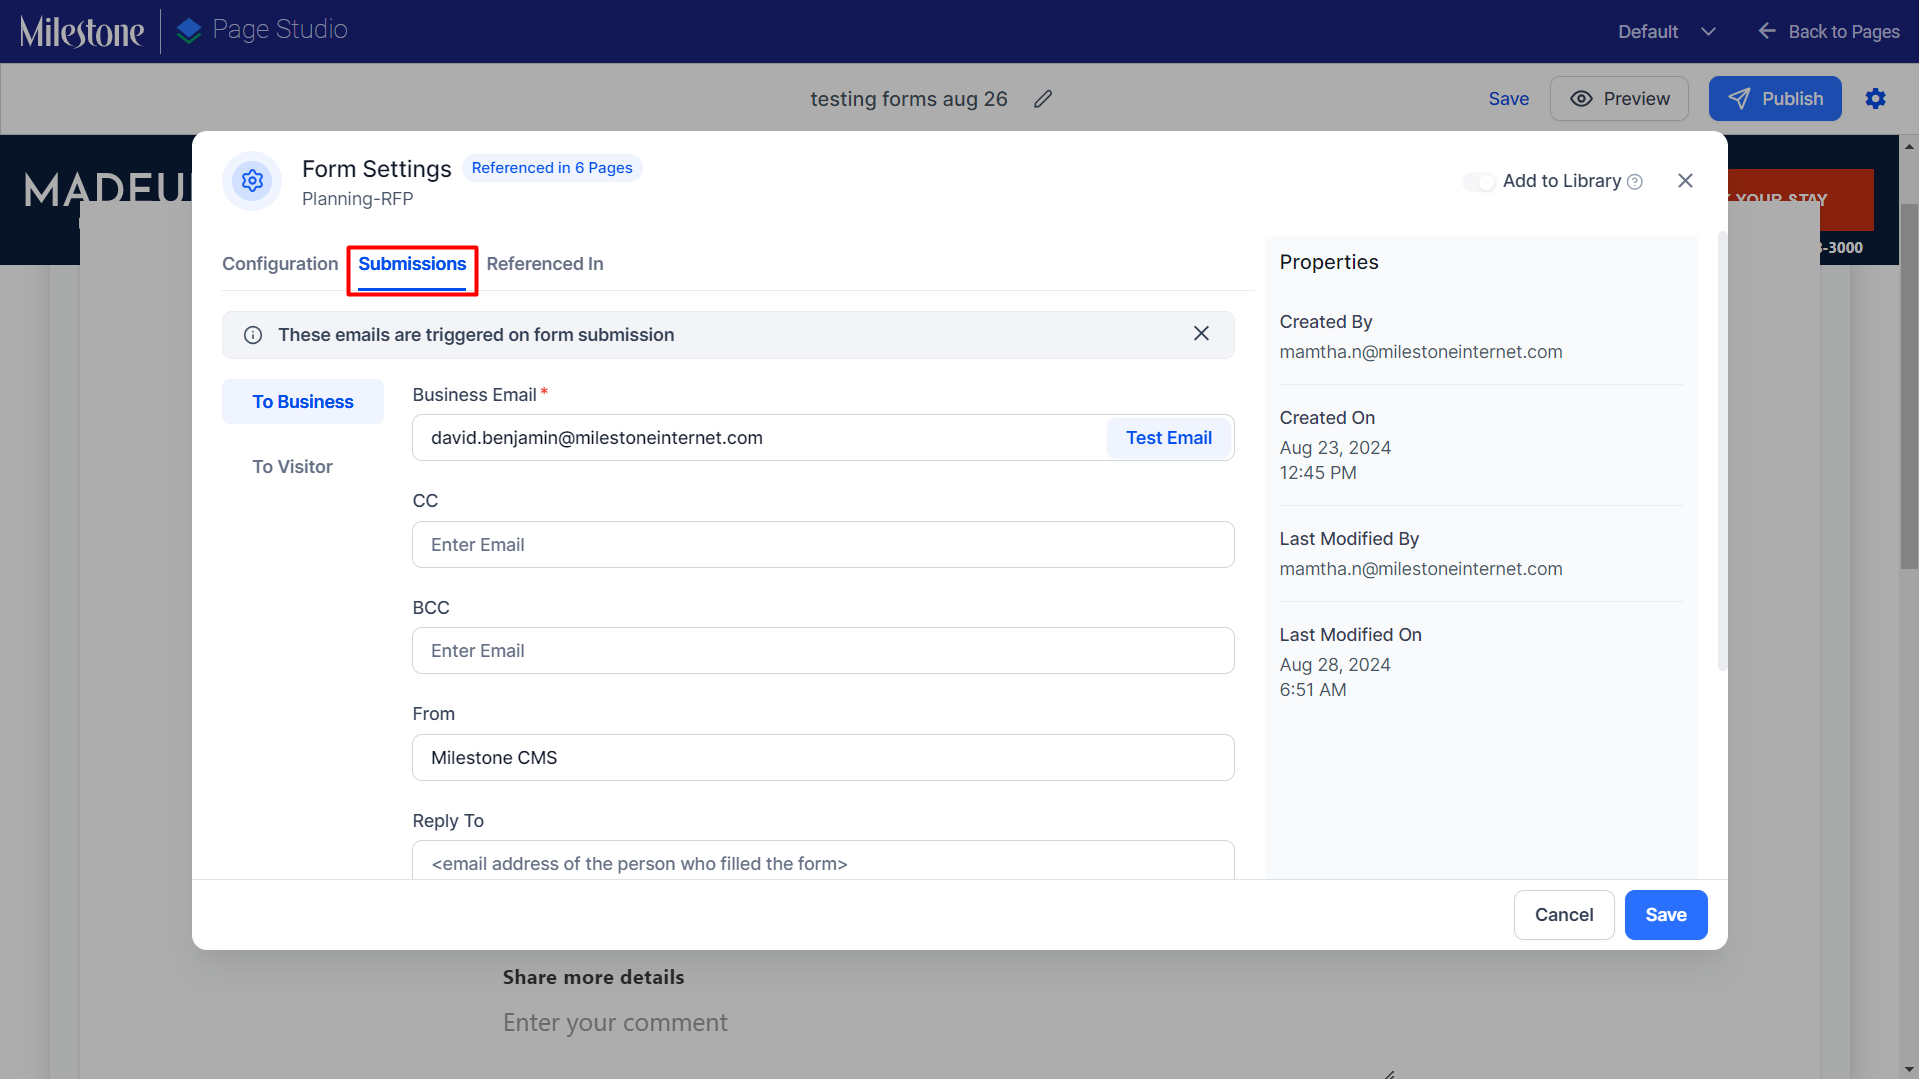
The submissions section lets you configure the email addresses to which the form submissions will be communicated and compose and send replies to form submissions.
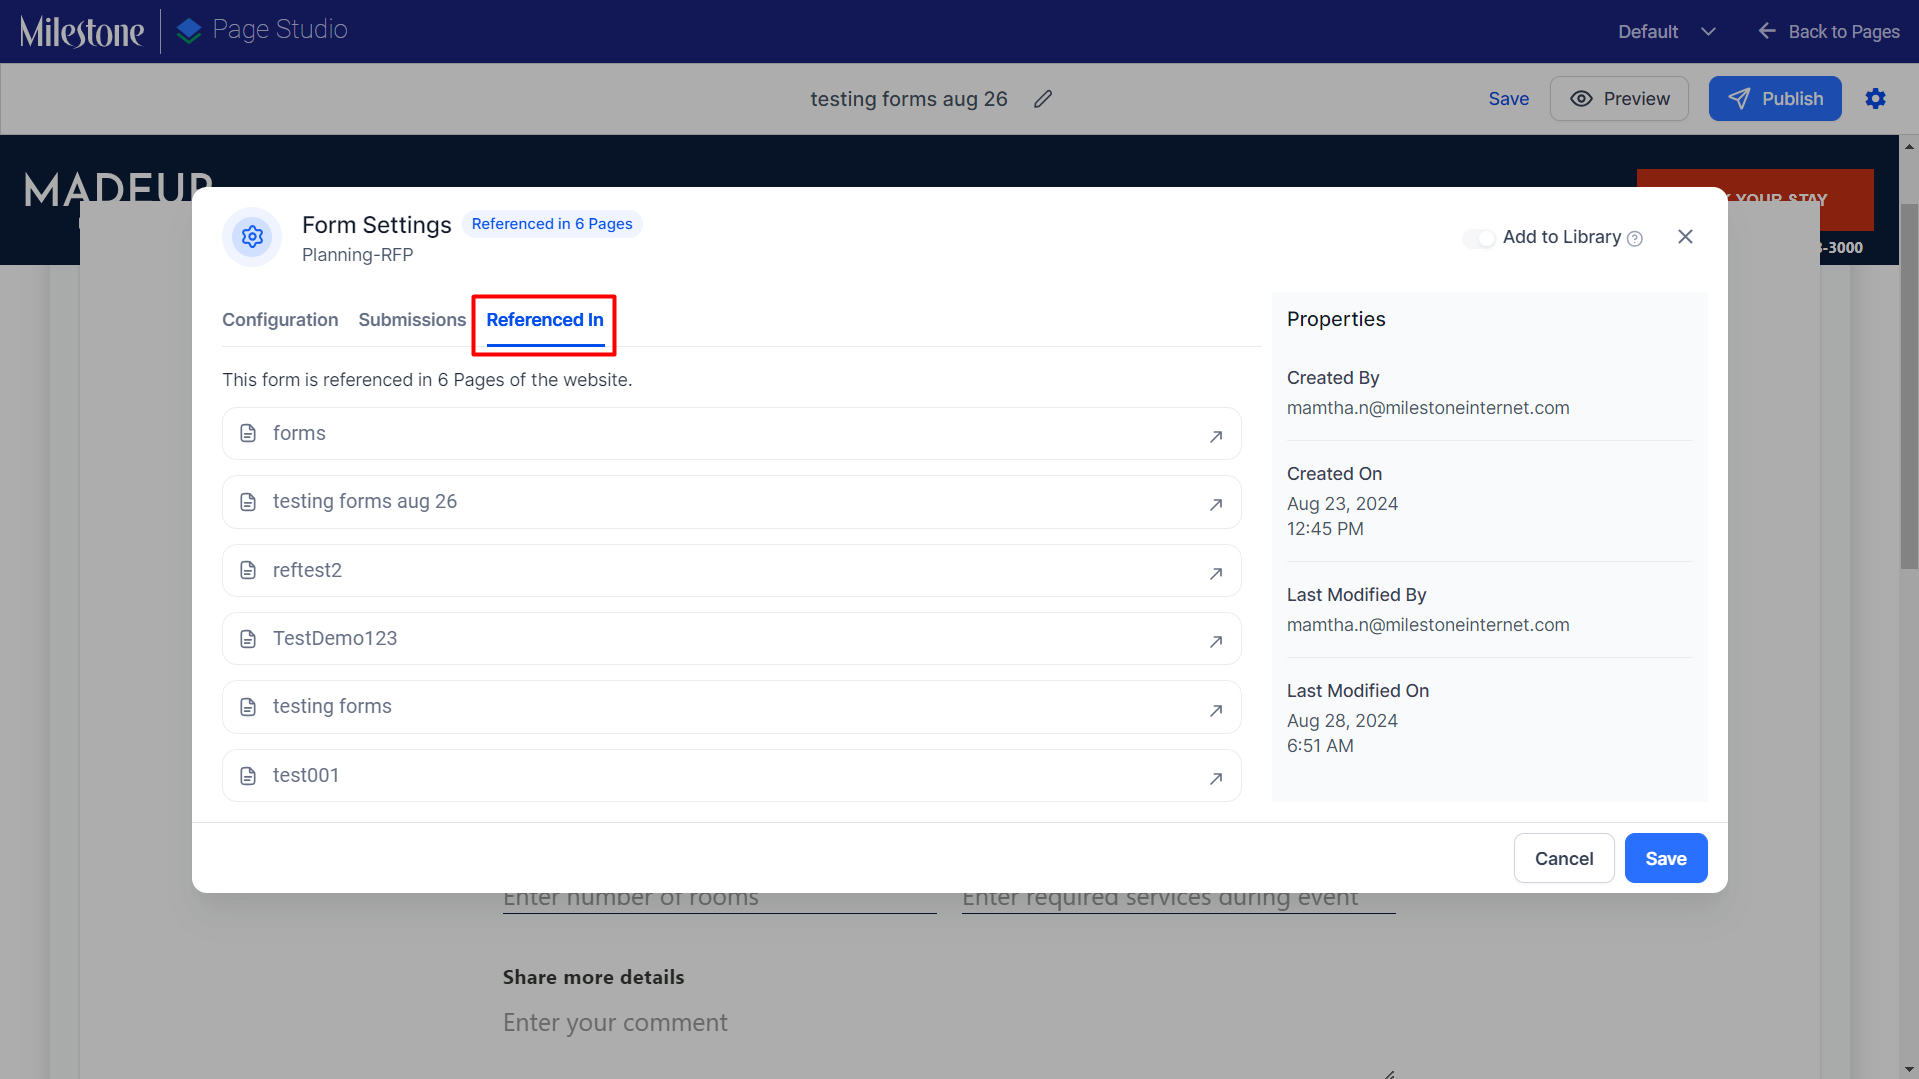
The Referenced In section lets you view which pages reference the same form on your website.
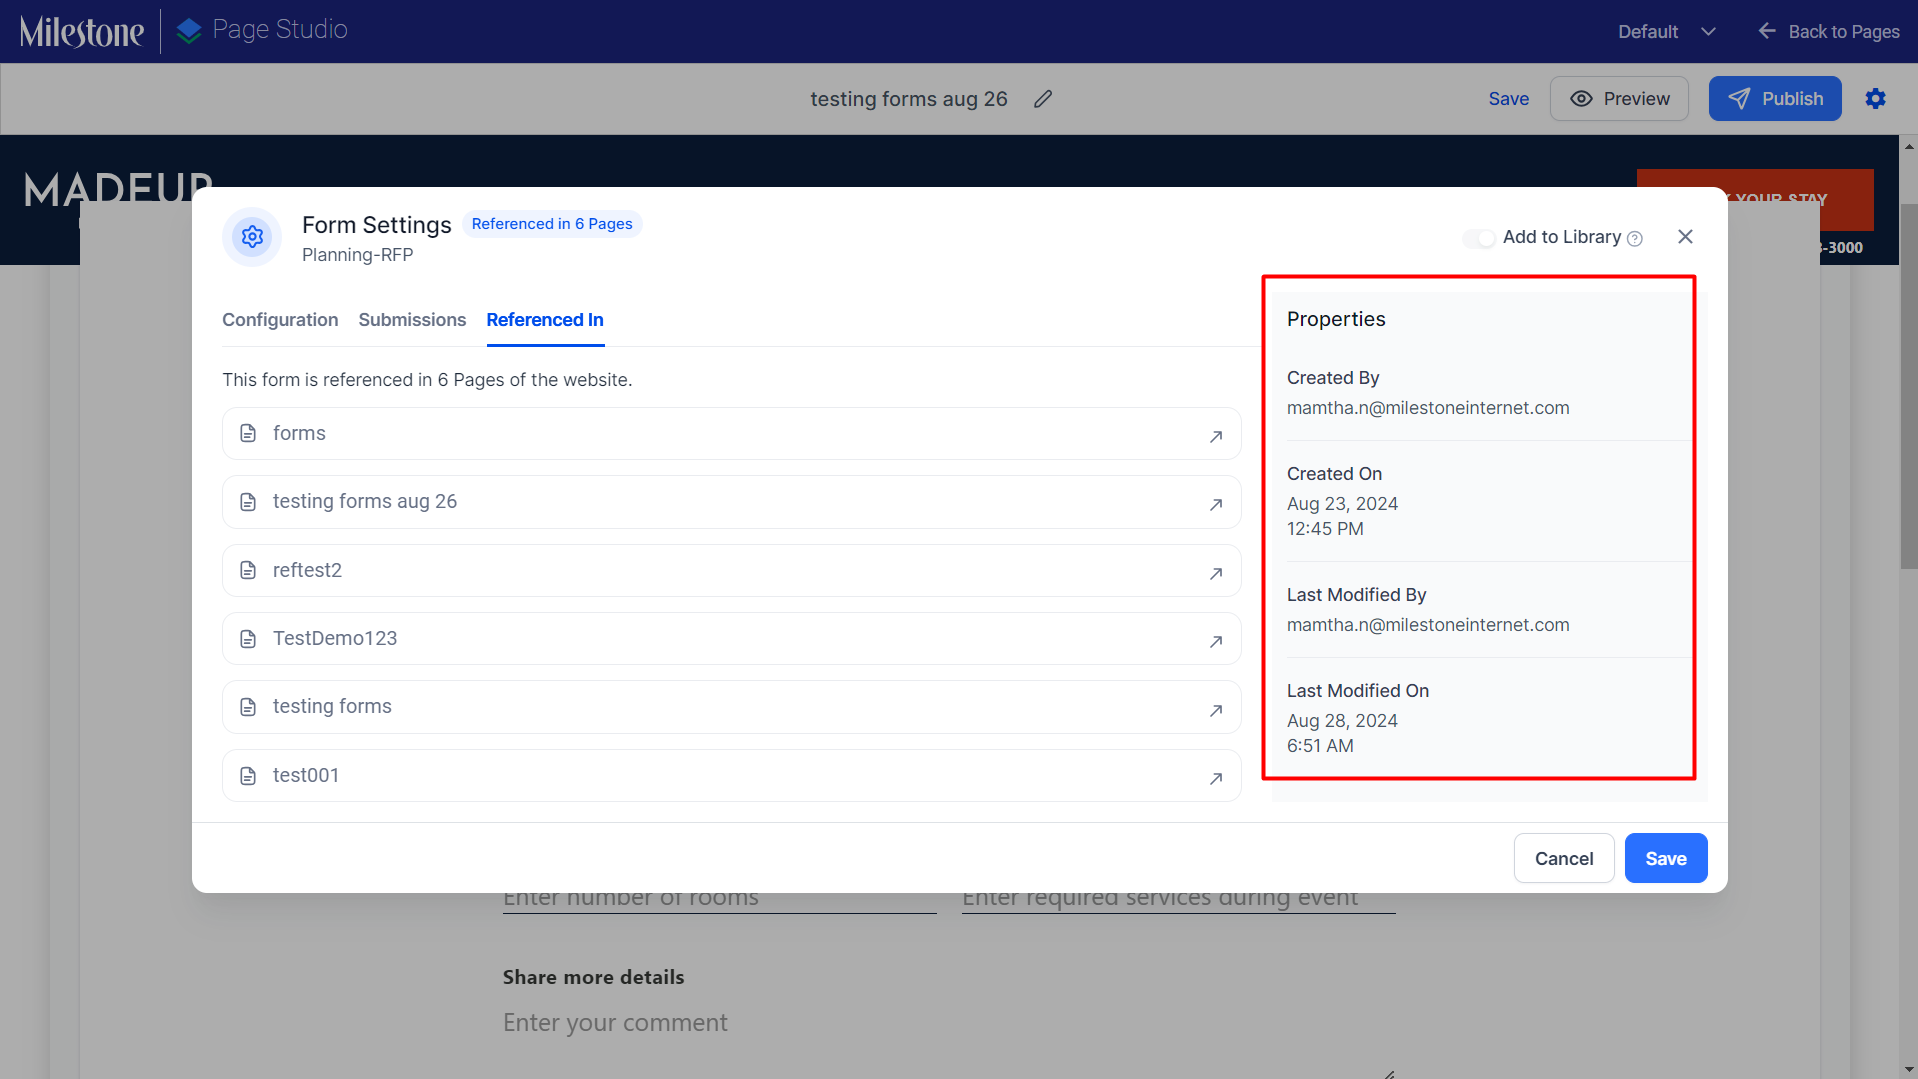
You can also view form properties like who created the form, the date it was created on, who made the last modifications to the form, and when was it last modified.
In conclusion, the introduction of form components within Page Studio marks a significant step forward in our commitment to enhancing user experience and advancing our componentization strategy. This new capability not only simplifies the process of designing and managing forms but also provides users with the tools they need to create more dynamic and engaging web pages. By empowering users with greater control and flexibility, we aim to foster creativity, efficiency, and productivity, setting a new standard for web page design and management in Page Studio.
Insights
Keyword Ranking Report
Path: Milestone Insights > Content & Relevancy > Keywords & SERPs
We're excited to announce a major revamp of our Keyword Ranking Report dashboard! While the current version is functional, it lacks essential key performance indicators (KPIs) and detailed visualizations that help users make quick, informed decisions. To address this, we're redesigning the dashboard to enhance usability, incorporate actionable insights, and increase engagement and adoption. Taking valuable input from clients like Neighborly, our goal is to create a more intuitive, competitive dashboard that delivers a superior user experience and stands out in the market. Stay tuned for these improvements, which will help you derive insights faster and more efficiently.
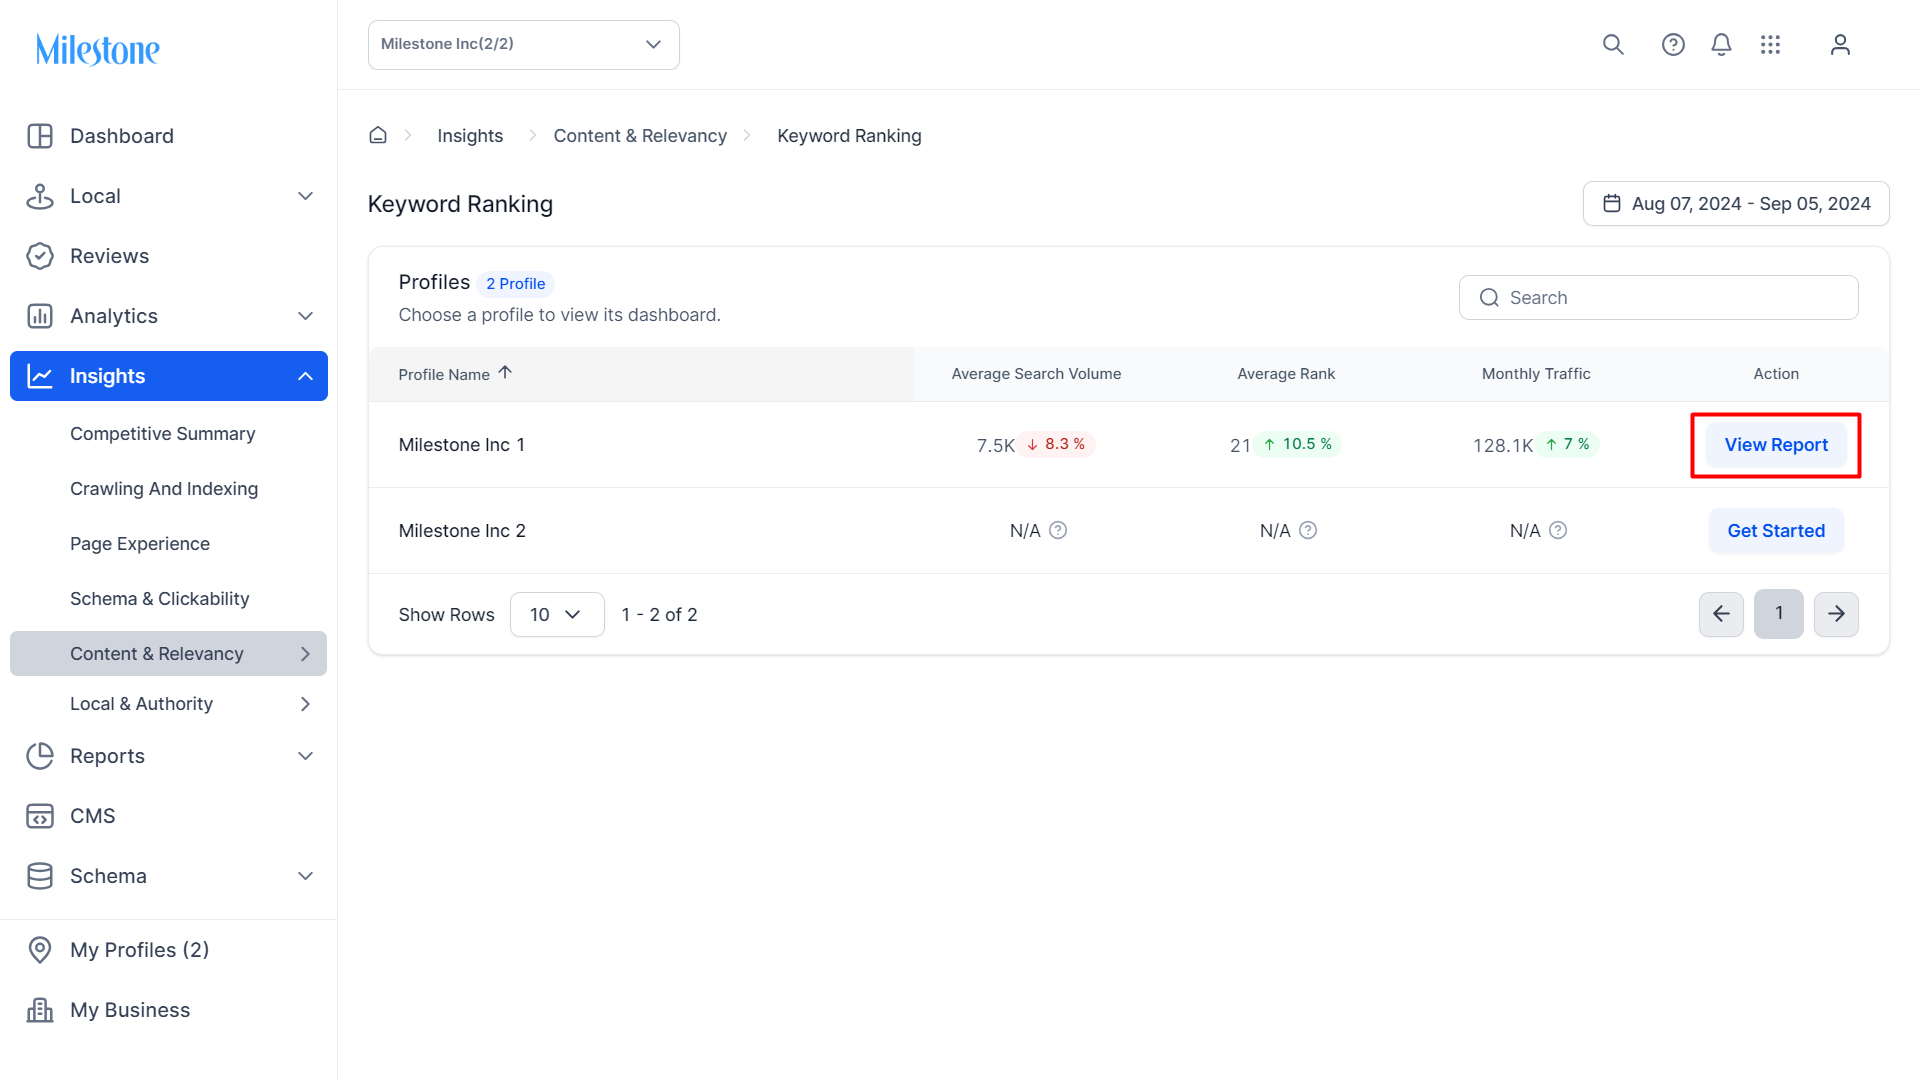
The Keyword Ranking section displays the performance of your business for keywords that you have chosen to rank for.
The Keywords and SERPs section of Milestone Insights displays your business profiles and three Key Performance Indicators (KPIs) in regard to keyword ranking and Search Engine Result Pages (SERPs);
-
Average Search Volume: Average Search Volume for a Website refers to the average number of searches per month for a set of keywords that are relevant to the website’s content, products, or services. This metric indicates how often users search for terms related to the website in search engines over a given period, usually measured on a monthly basis. Understanding the average search volume helps website owners and marketers identify high-demand keywords, optimize content, and develop strategies to improve search engine visibility. A higher average search volume for targeted keywords typically suggests greater potential to attract traffic to the website through search engine optimization (SEO).
-
Average Rank: Average Rank refers to the mean position of a website’s pages in search engine results for a set of targeted keywords over a specific period. It is calculated by taking the ranking positions of a website across multiple search queries or keywords and finding the average of those positions. This metric helps measure the overall visibility and performance of a website in search engine results pages (SERPs). A lower average rank number indicates better performance, as it reflects that the website consistently appears higher in search results, which can lead to increased traffic and user engagement.
-
Monthly Traffic: Monthly Traffic for a Website refers to the total number of visits or sessions a website receives over a one-month period. This metric encompasses all visits from all sources, including organic search, direct traffic, referrals, social media, and paid advertising. Monthly traffic is a key performance indicator (KPI) for understanding a website's visibility, reach, and overall online presence. It provides insights into user interest, content effectiveness, and marketing performance, helping website owners and marketers gauge the success of their strategies and identify opportunities for growth or improvement.
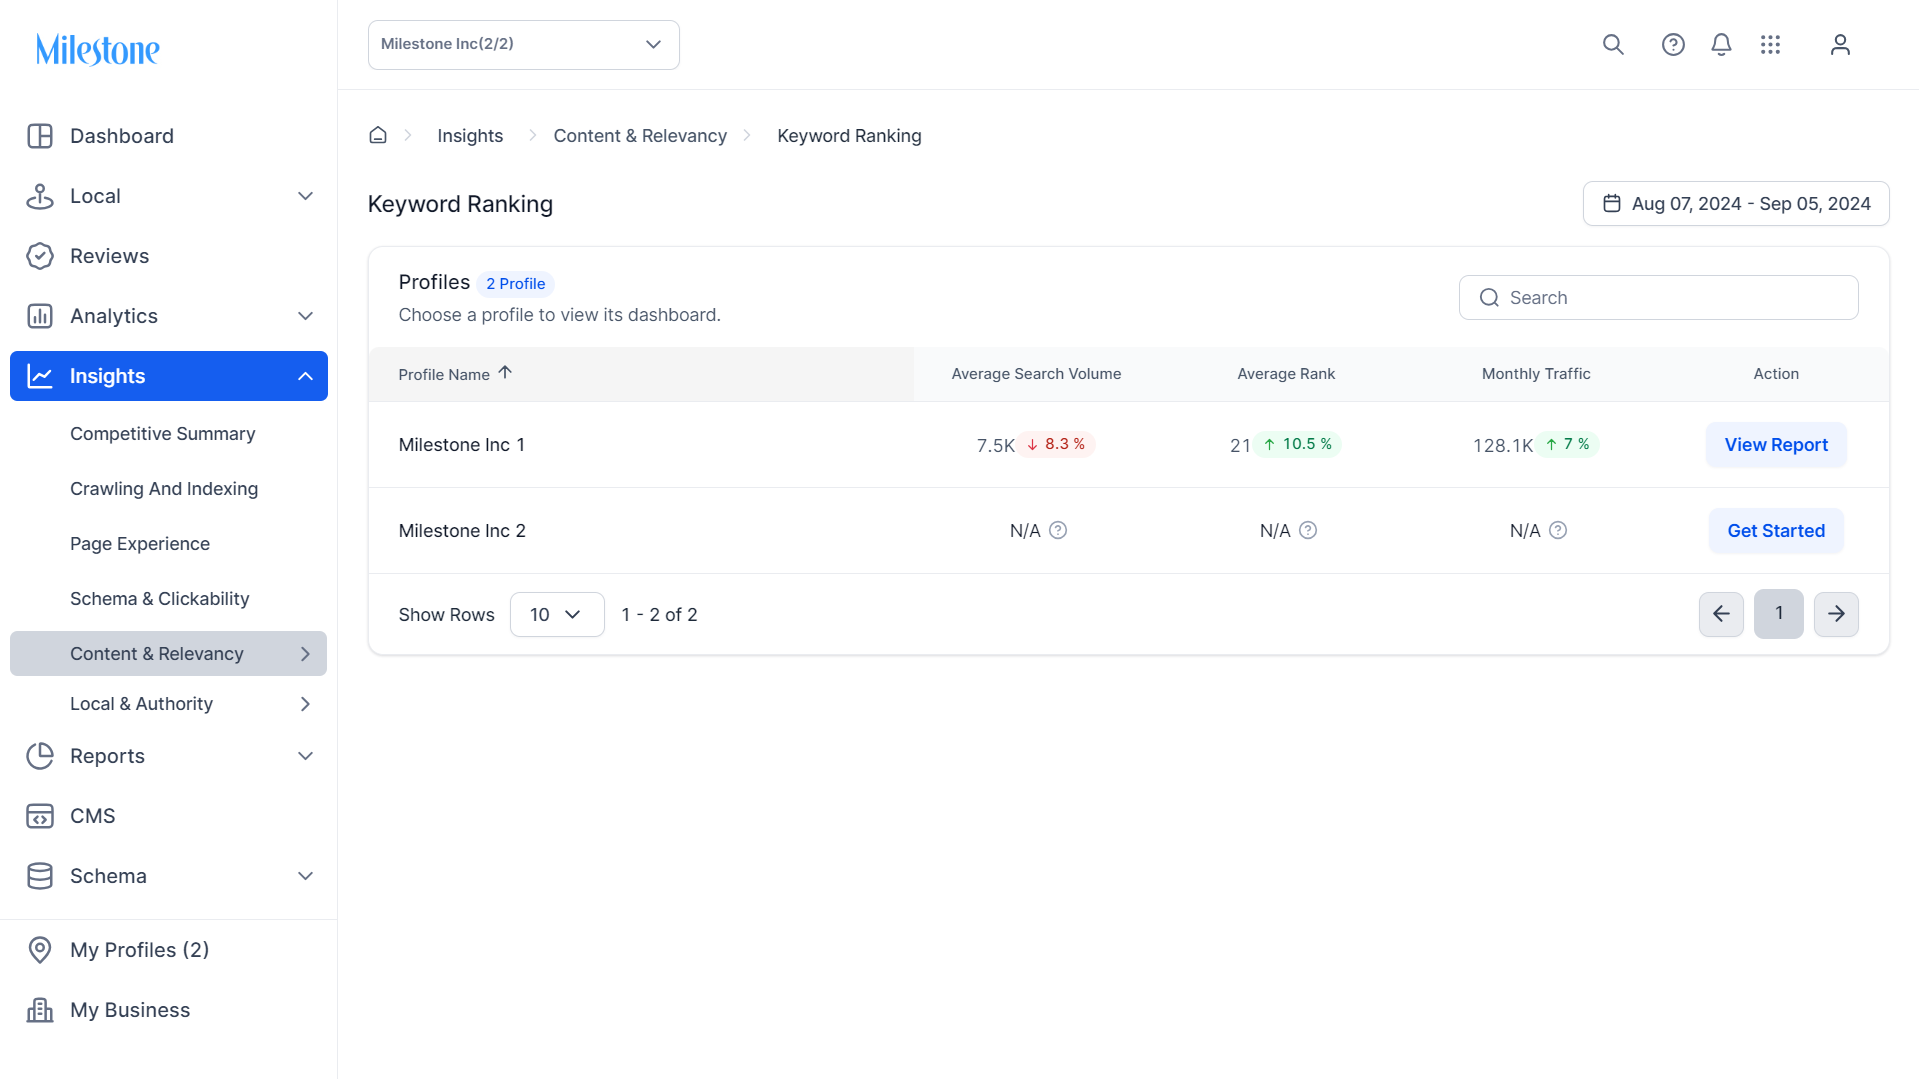
To view the keyword performance for a business profile click on ‘View Report’ in the right most column.
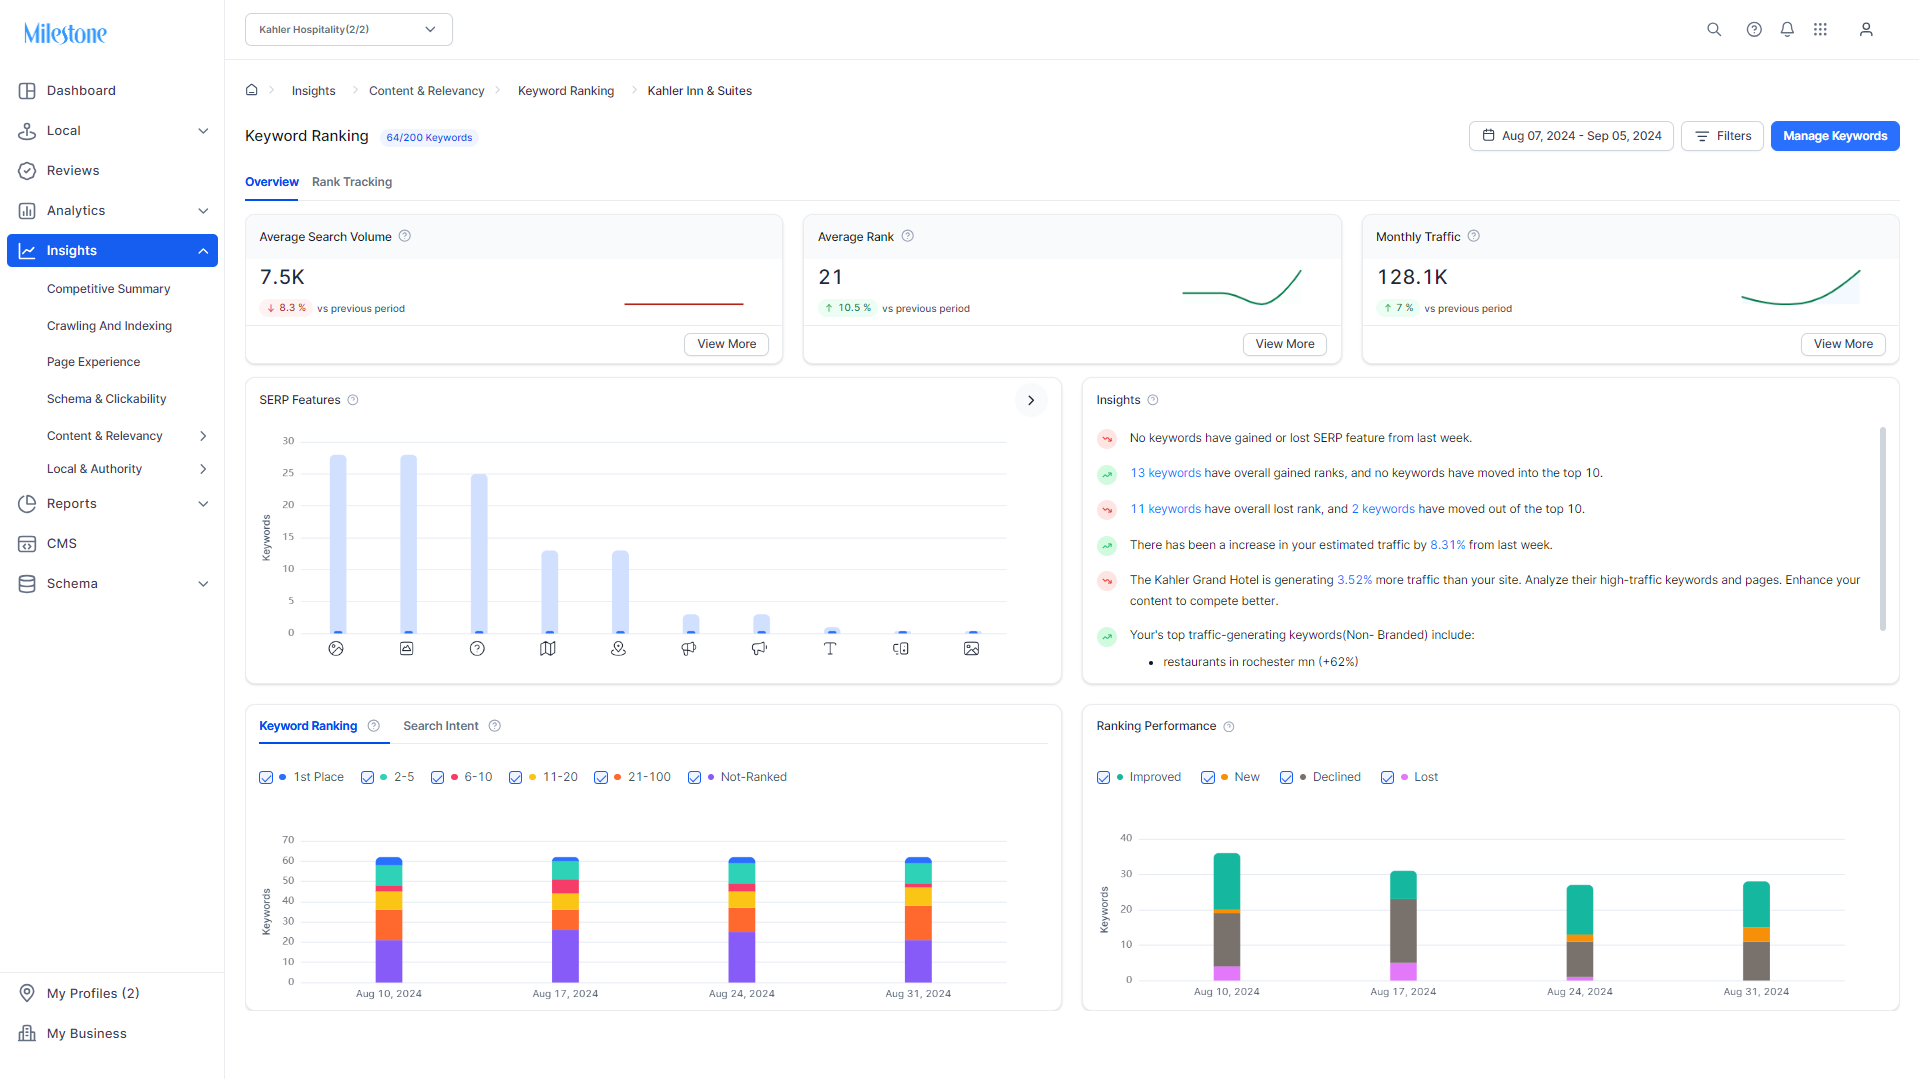
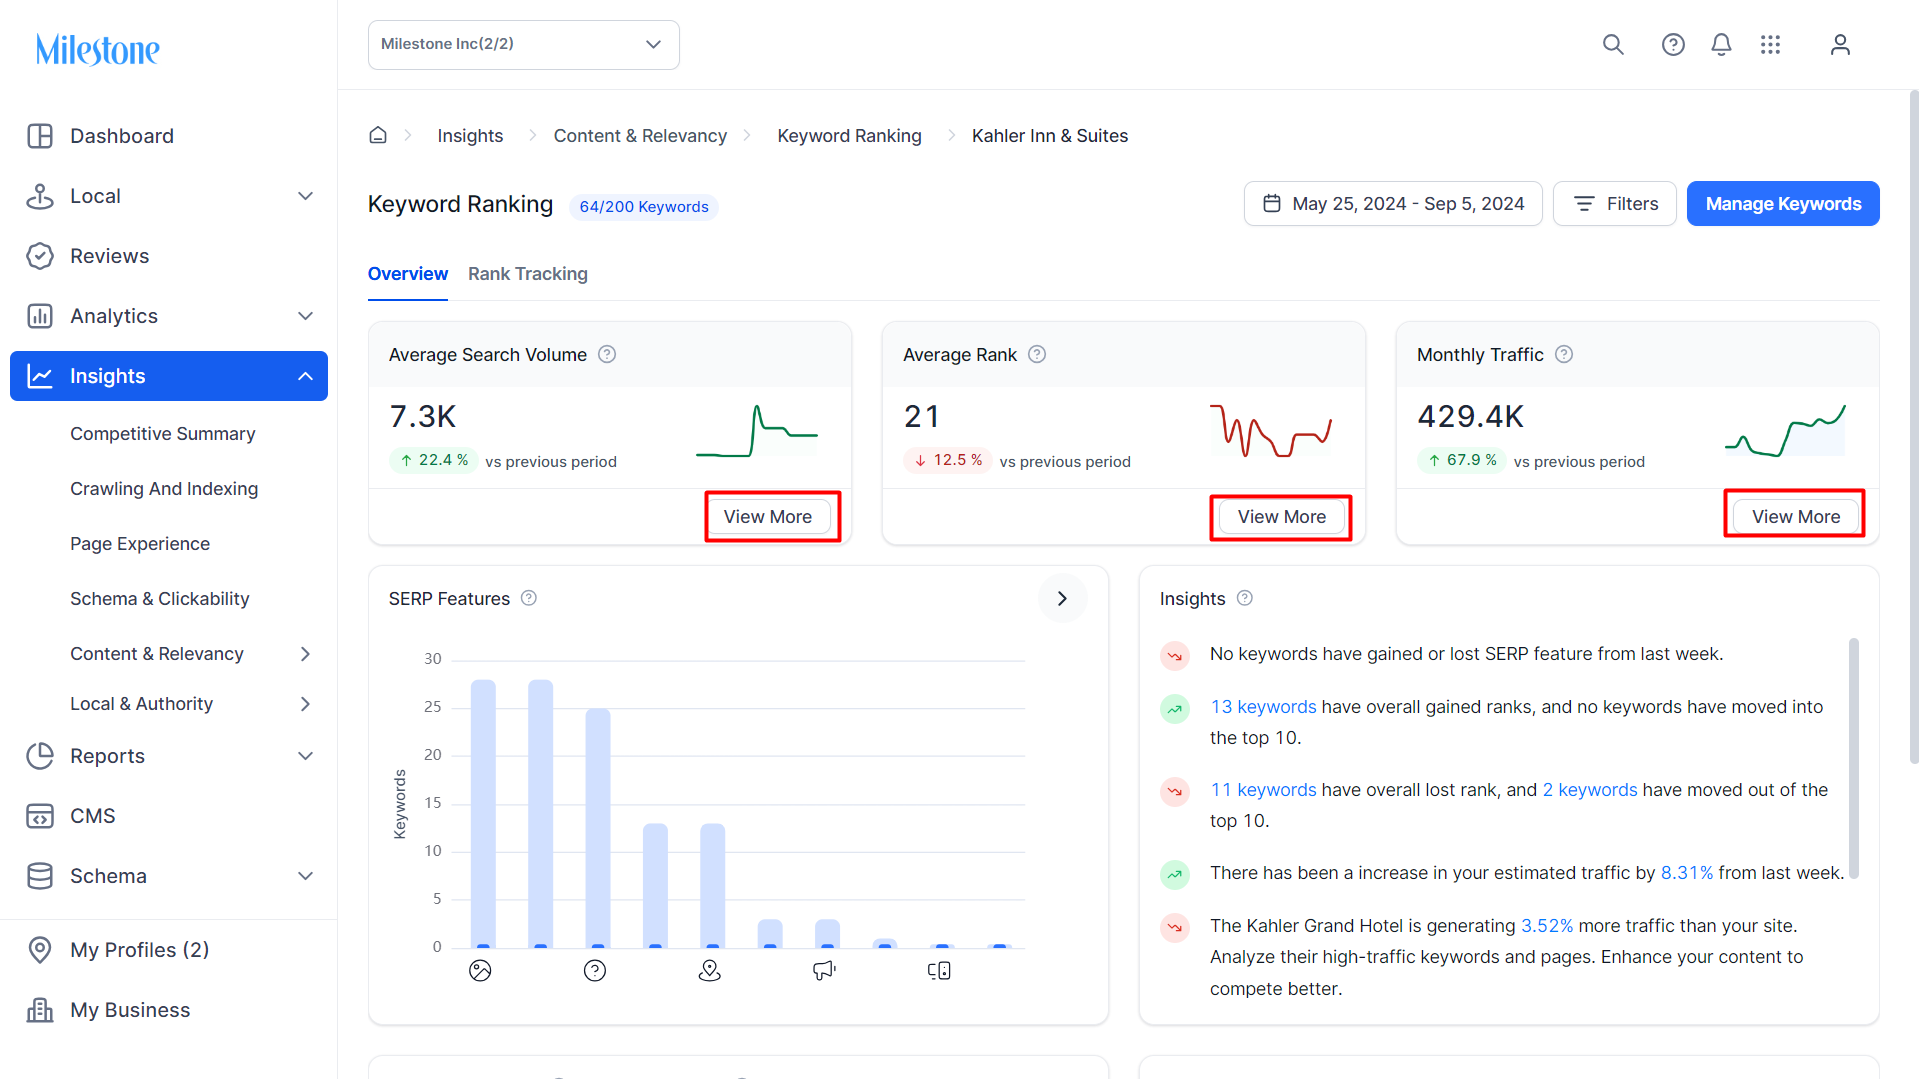
Overview
The ‘Overview’ section of the Keyword Ranking Report displays data for Average Search Volume, Average Rank, and Monthly Traffic at the top. Click on ‘View More’ to view a trend graph of these KPIs over the selected time period.
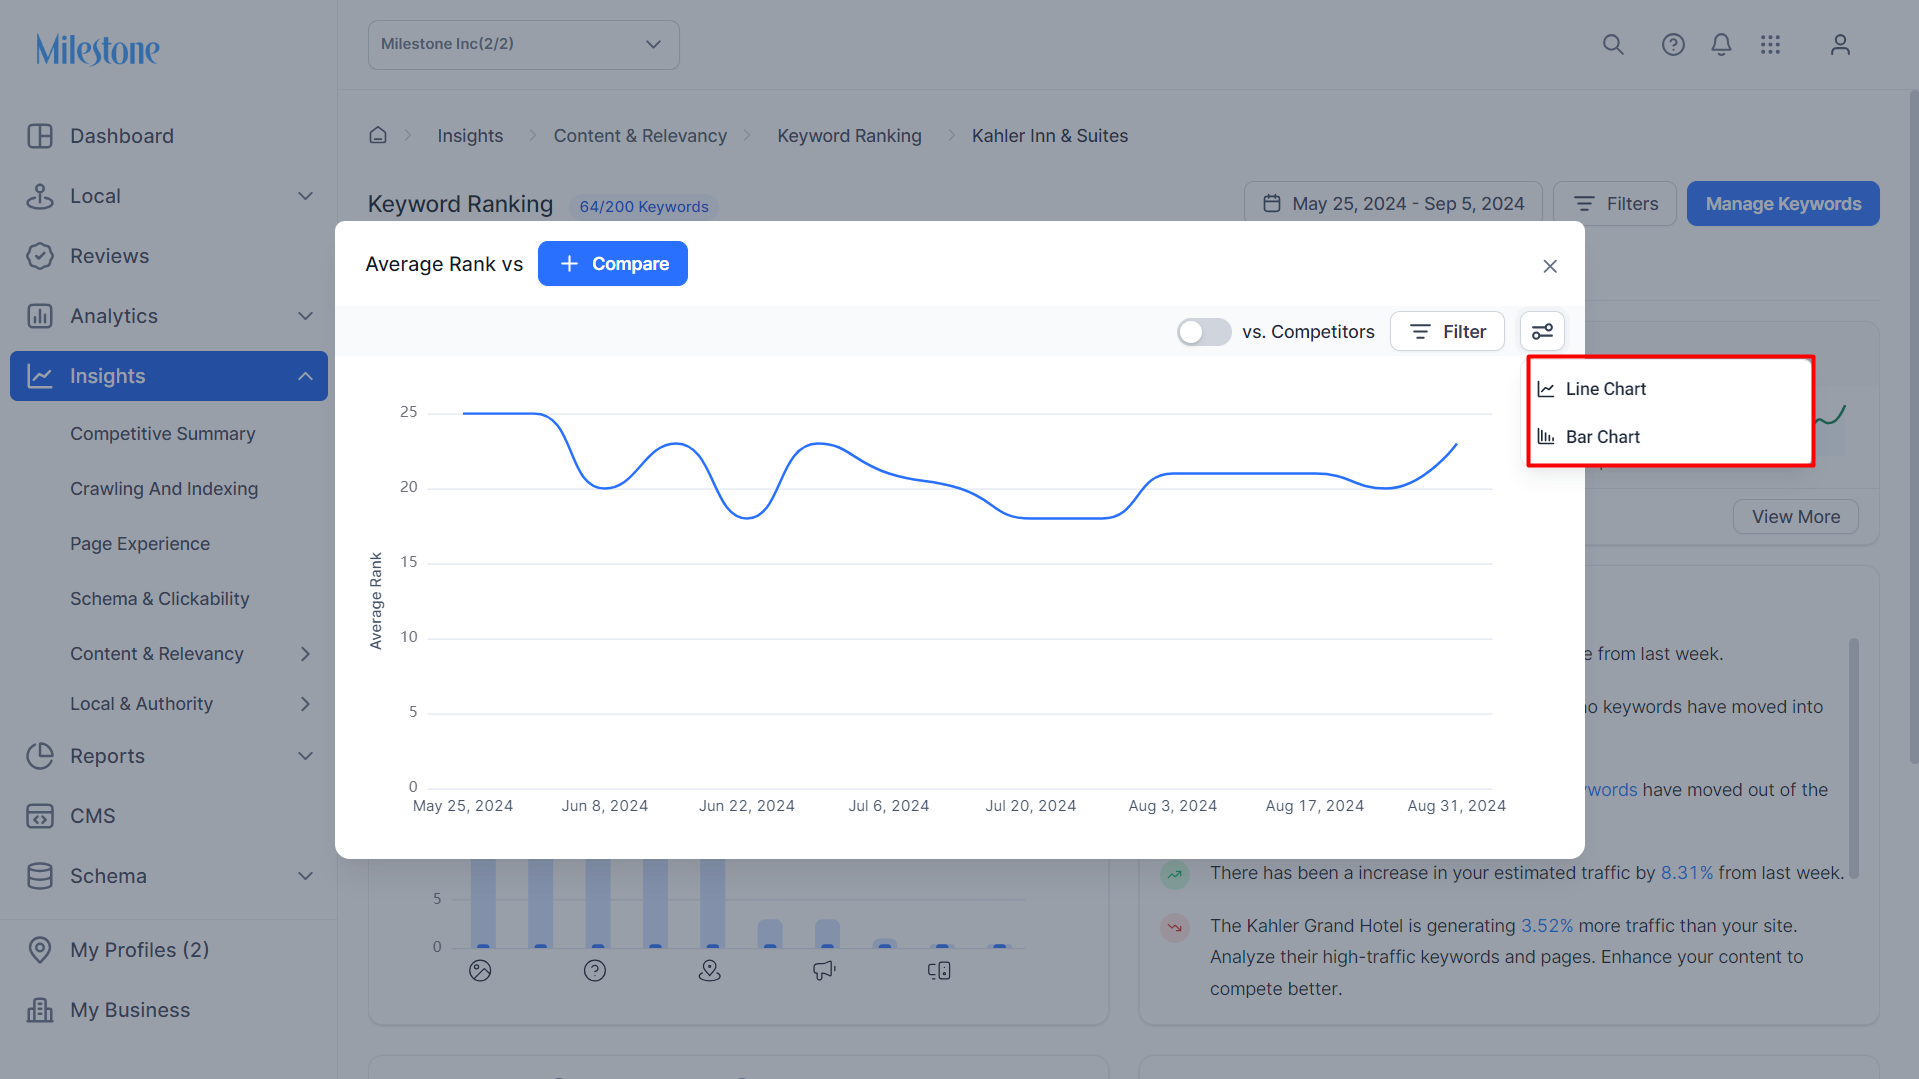
Click on ‘Compare’ to the top of the trend graph section to compare the KPI with one of the other two KPIs.
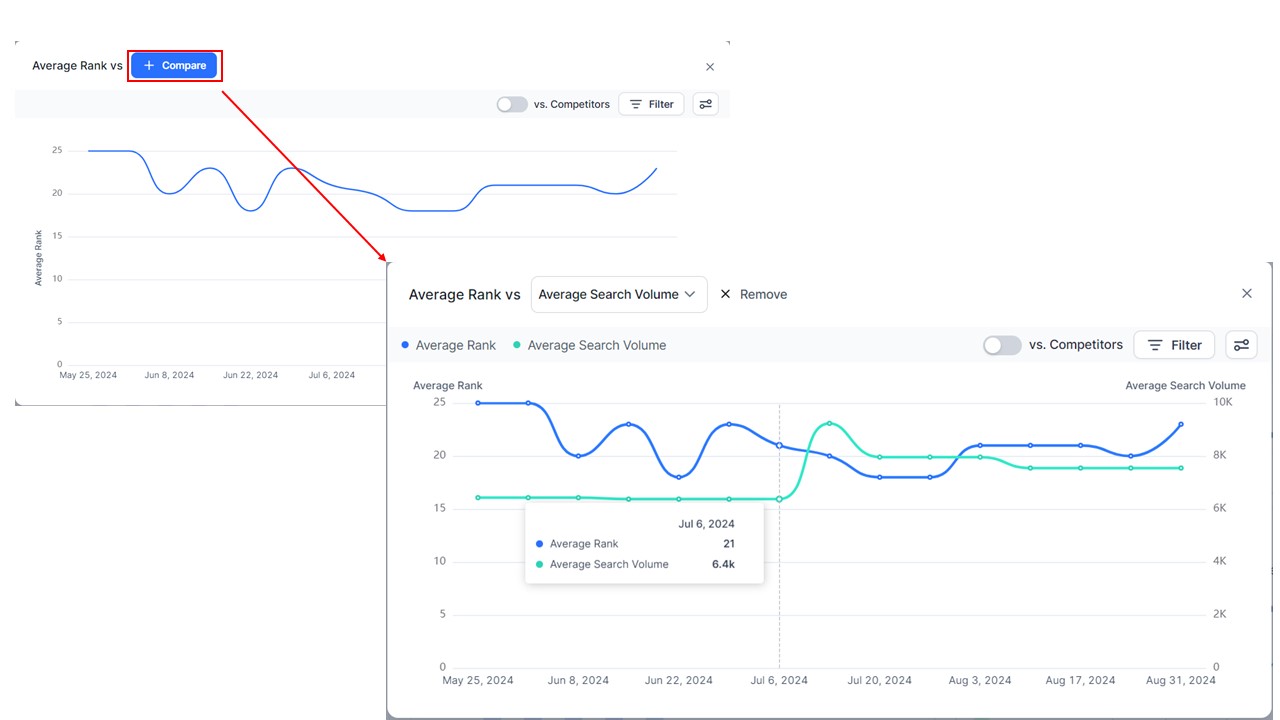
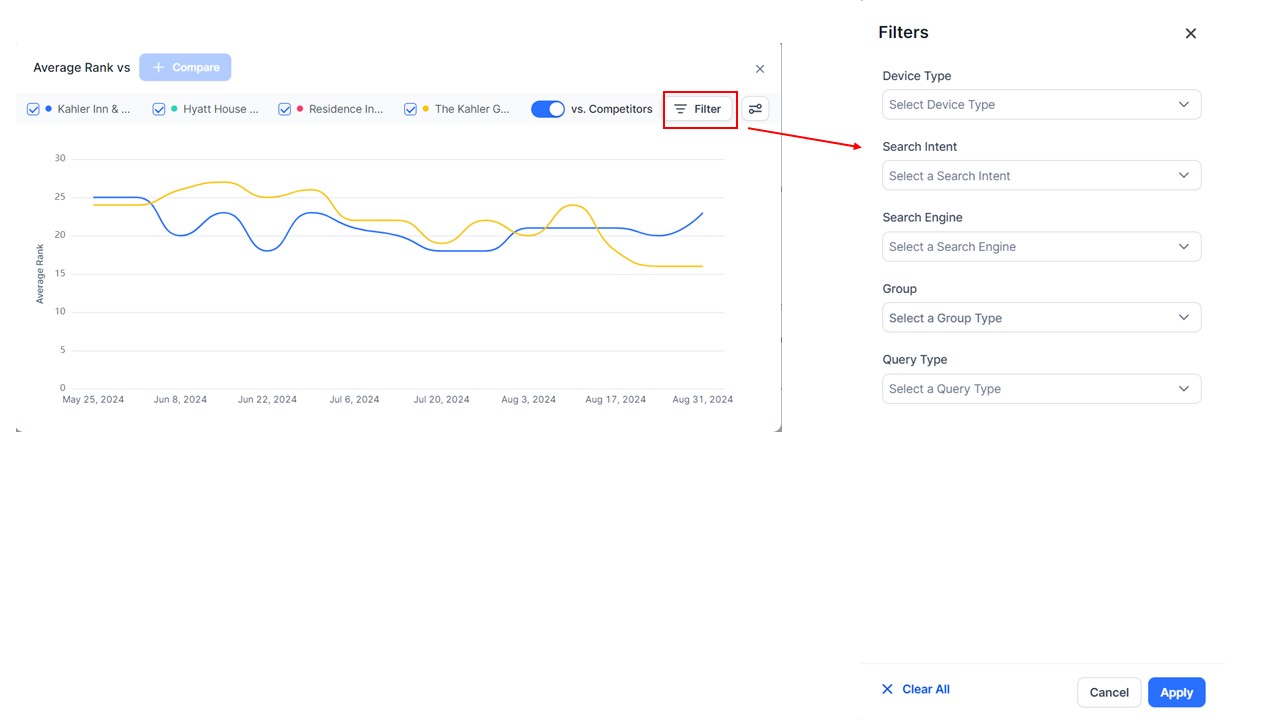
To view this data against your competitors click on the ‘vs Competitors’ toggle button.
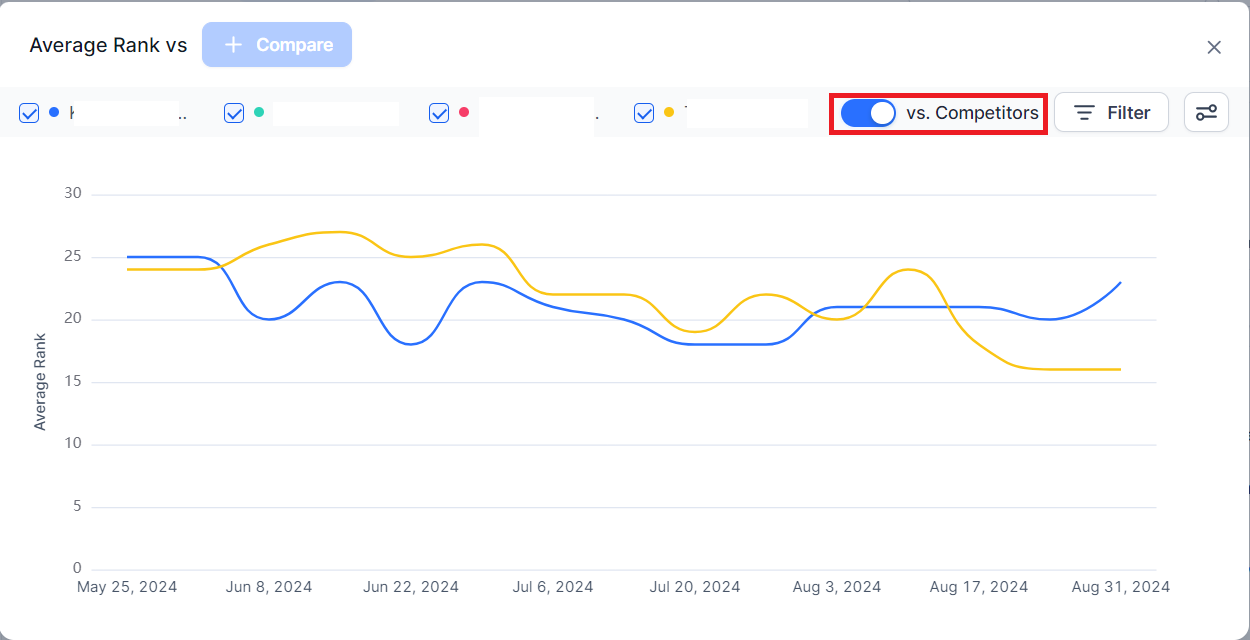
The expansive filter options allow you to filter data by device type, search intent, search engines, keyword group, and query types.
You can also choose between a line chart and a bar chart to view the data.
SERP Features
The SERP Features section displays your keyword performance for special elements in search results, such as featured snippets, images, or local packs, where your keyword appeared during the last week.
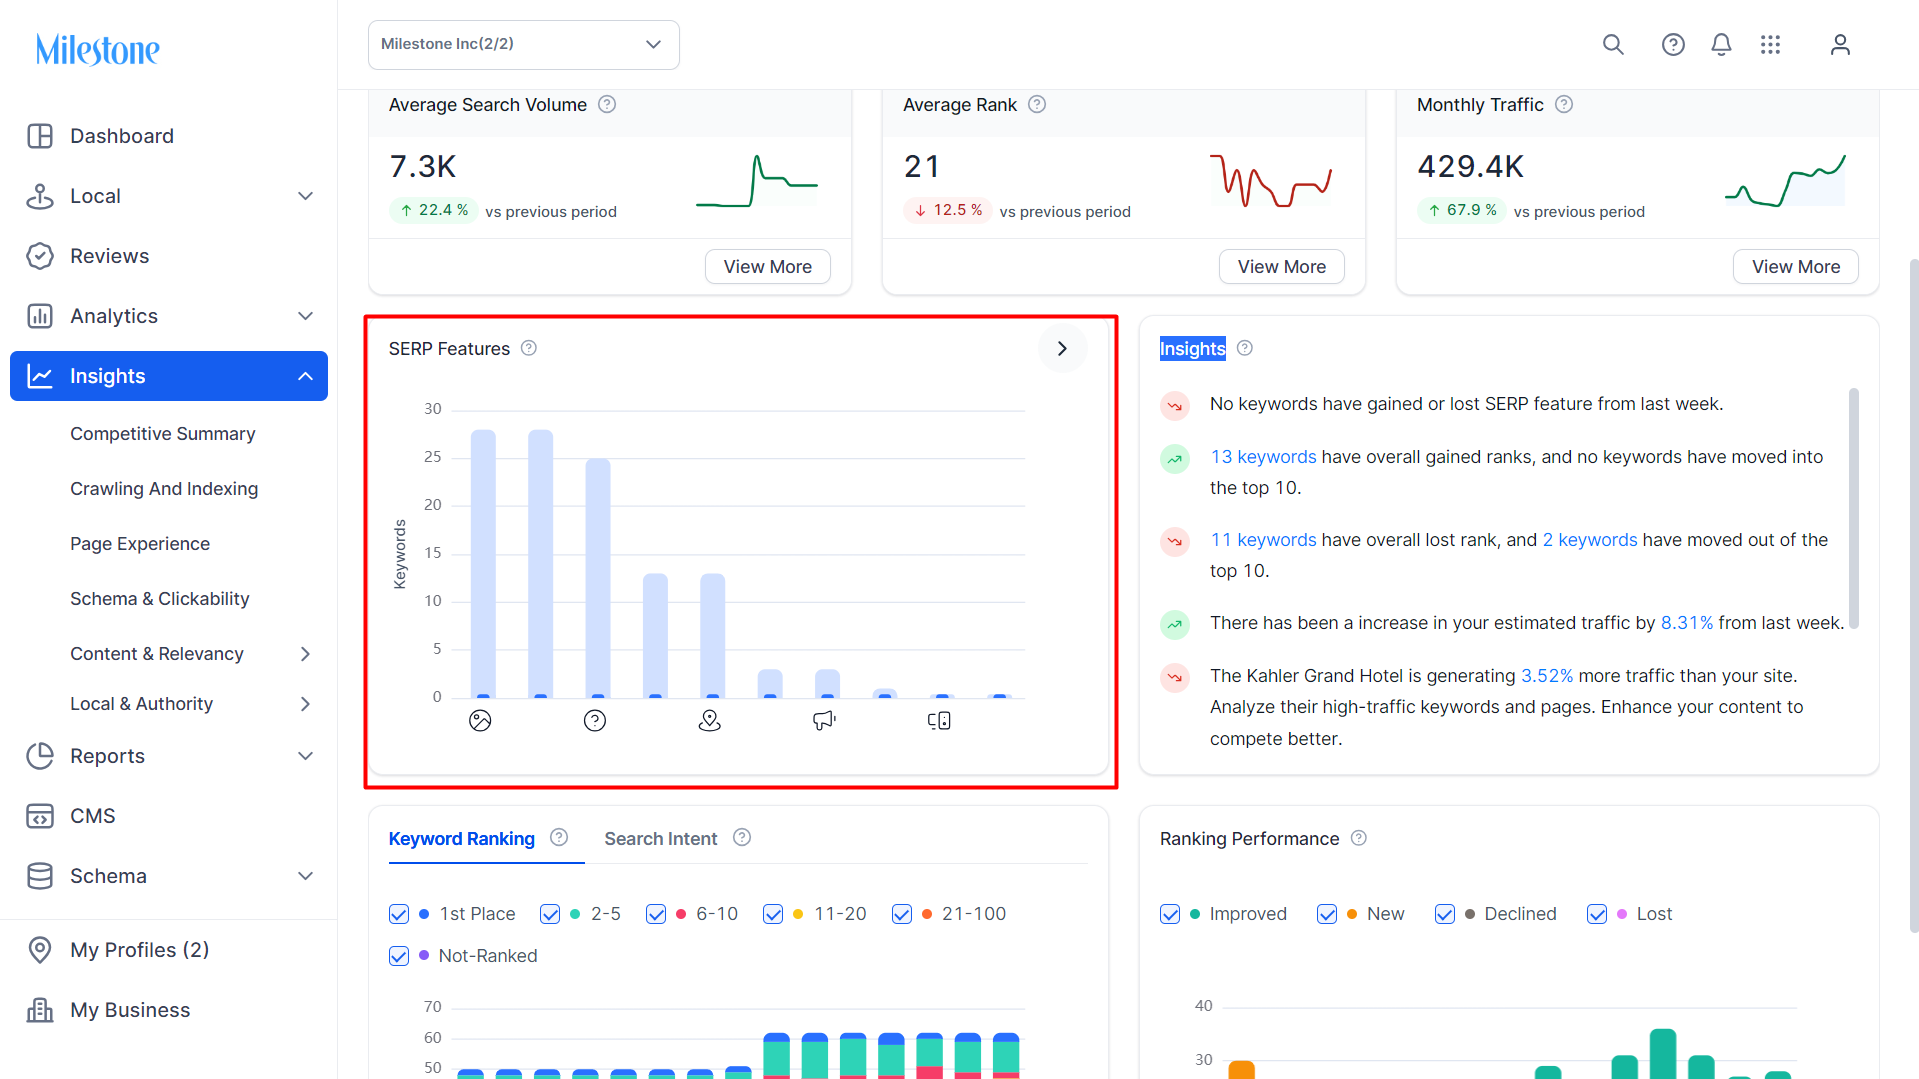
The light blue bar denotes the number of keywords that have ranked for the SERP features and the dark blue bar denotes the number of your keywords that ranks for the SERP feature.
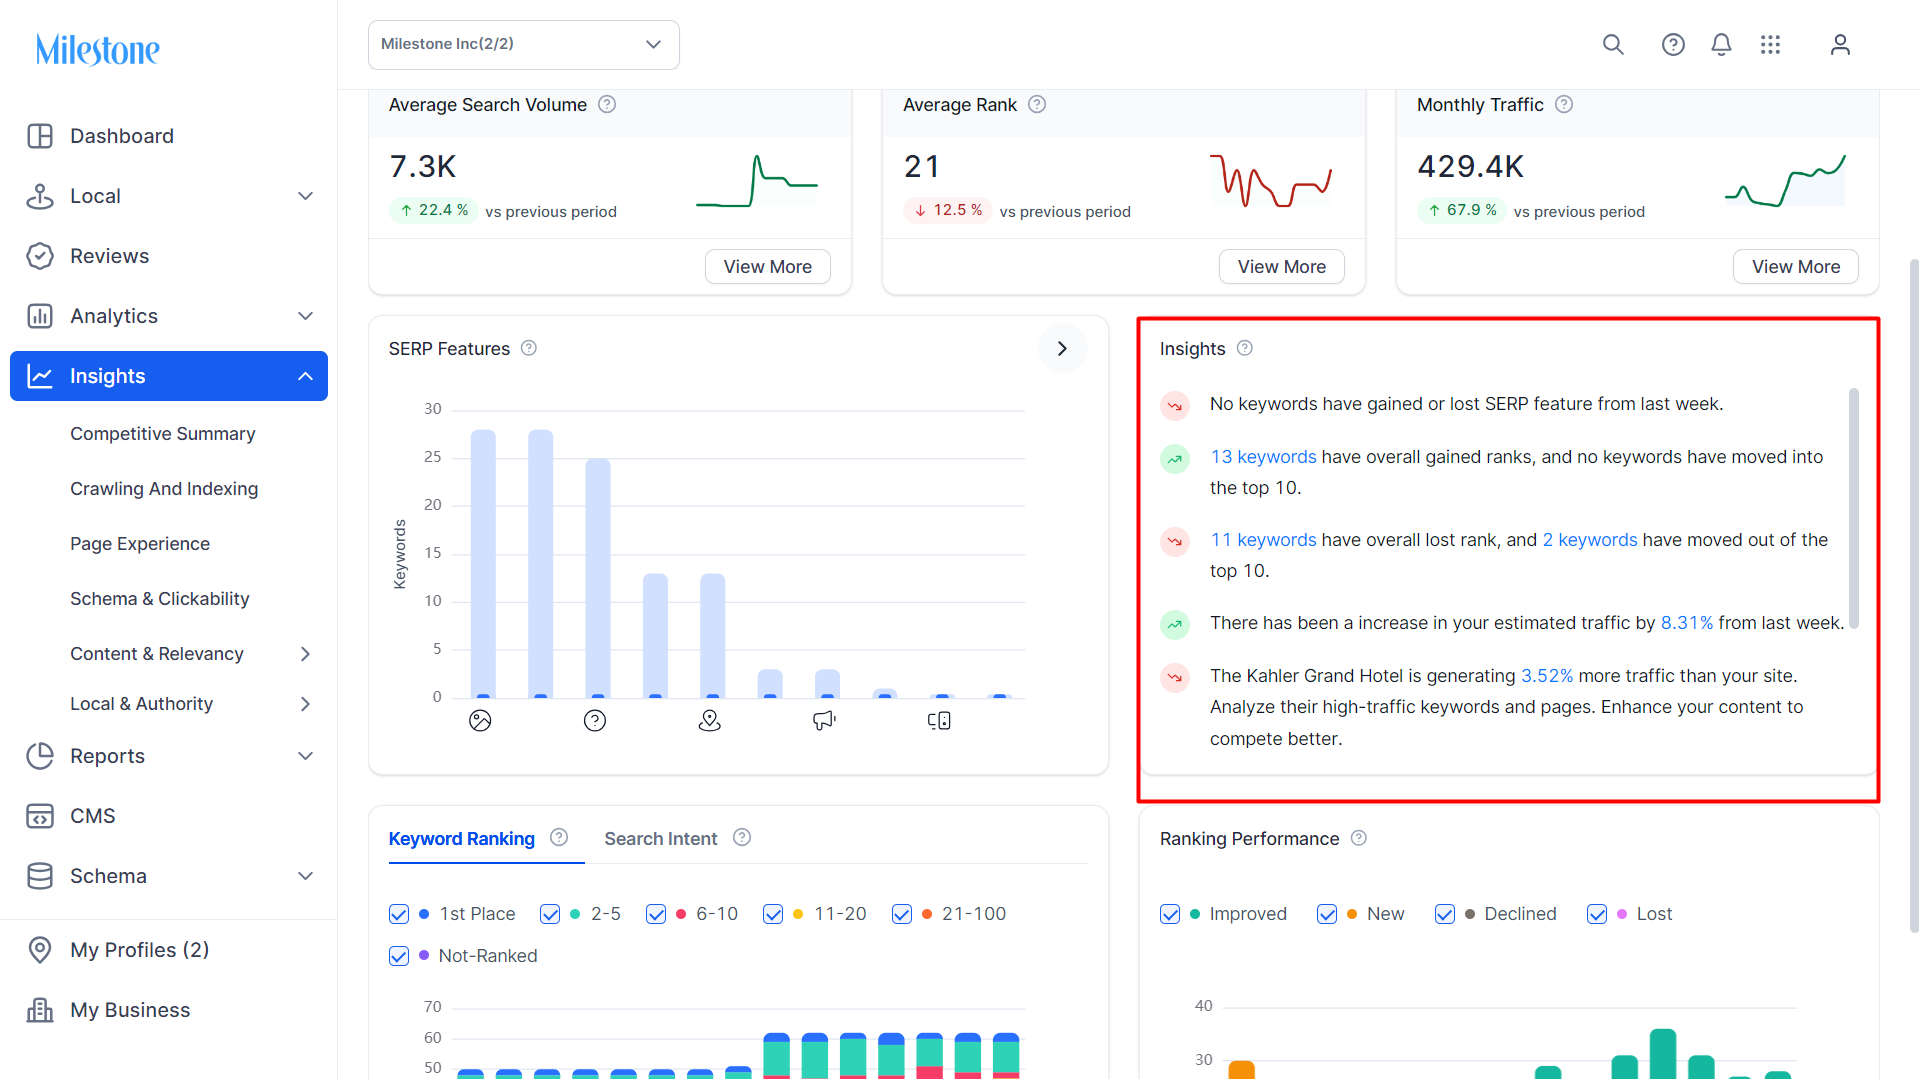
Insights
The Insights section displays actionable insights that can help you improve your overall keyword performance on SERPs. This is a summary indicating whether your keyword performance has improved or declined. The insights are based on the performance from the last week, compared to the previous week.
Keyword Ranking
The Keyword Ranking section displays your ranking for keywords over a period. The keyword rank is denoted by colors.
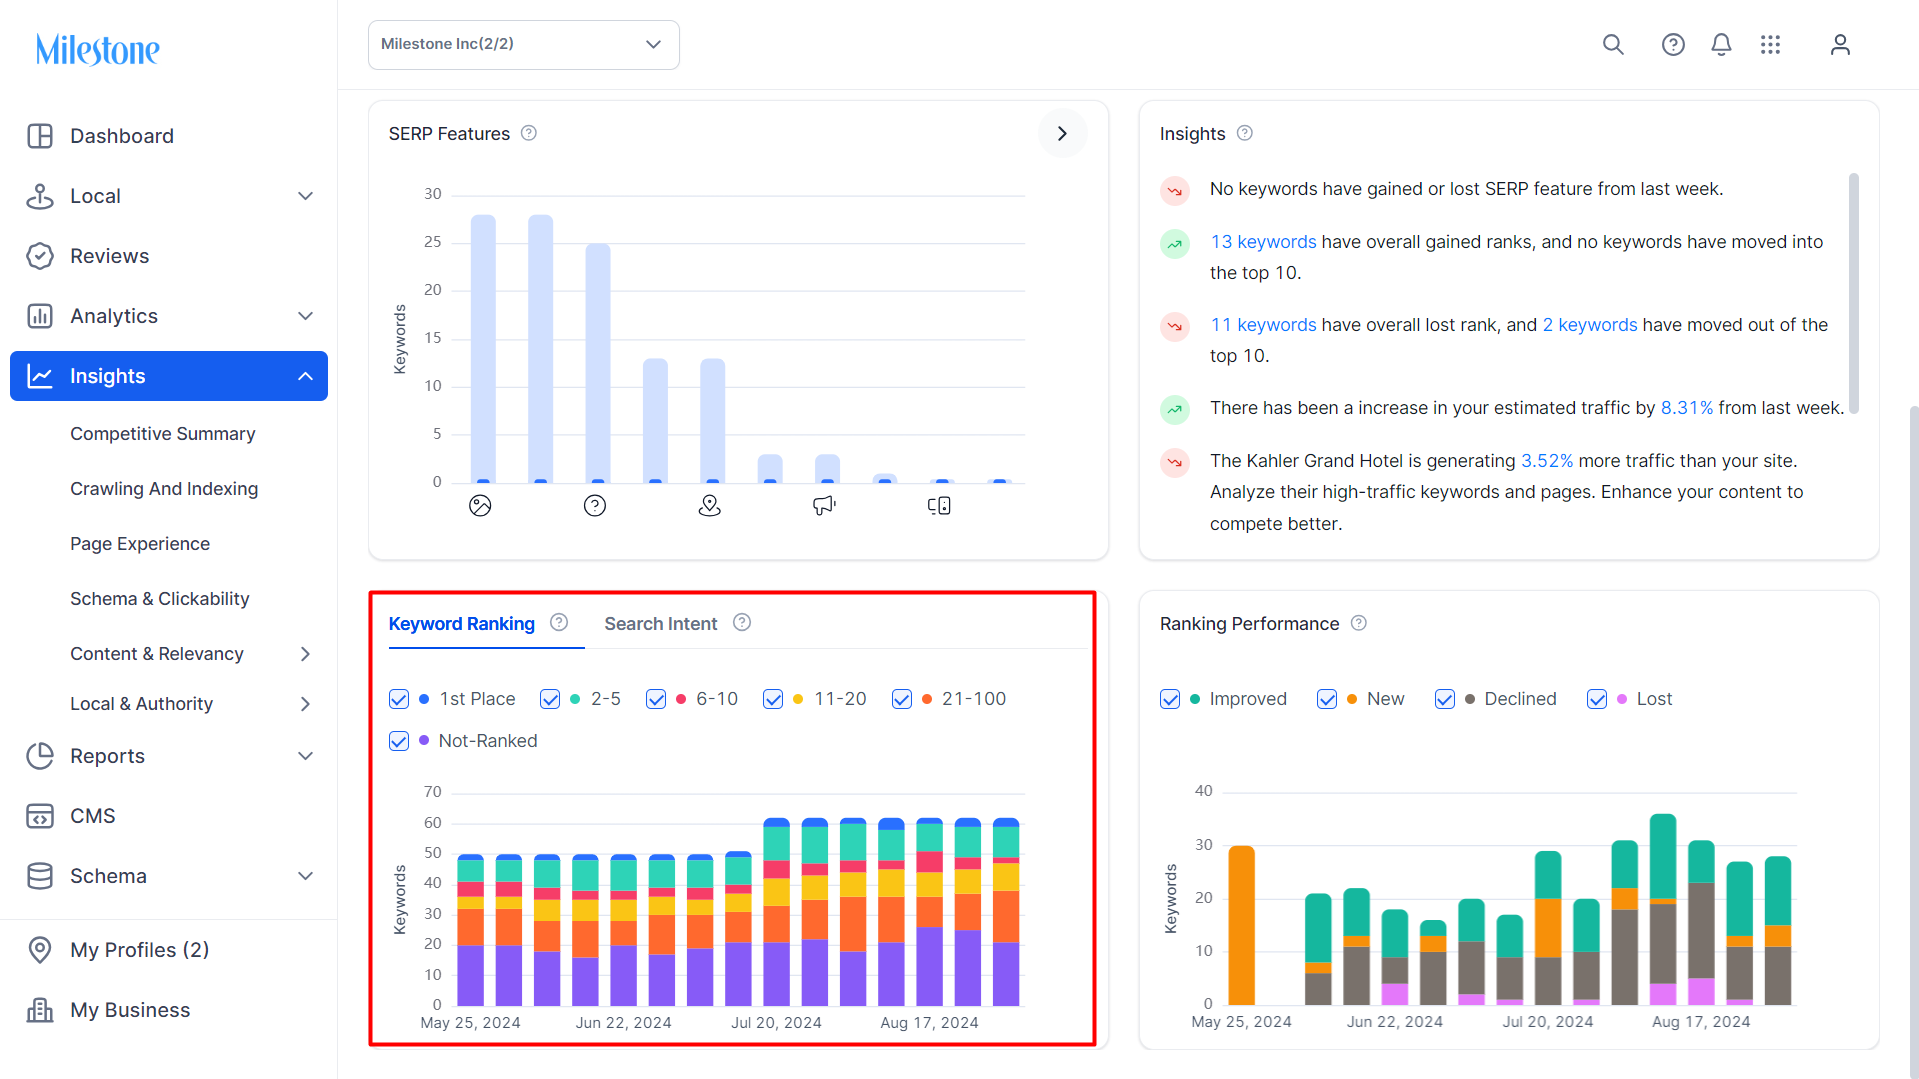
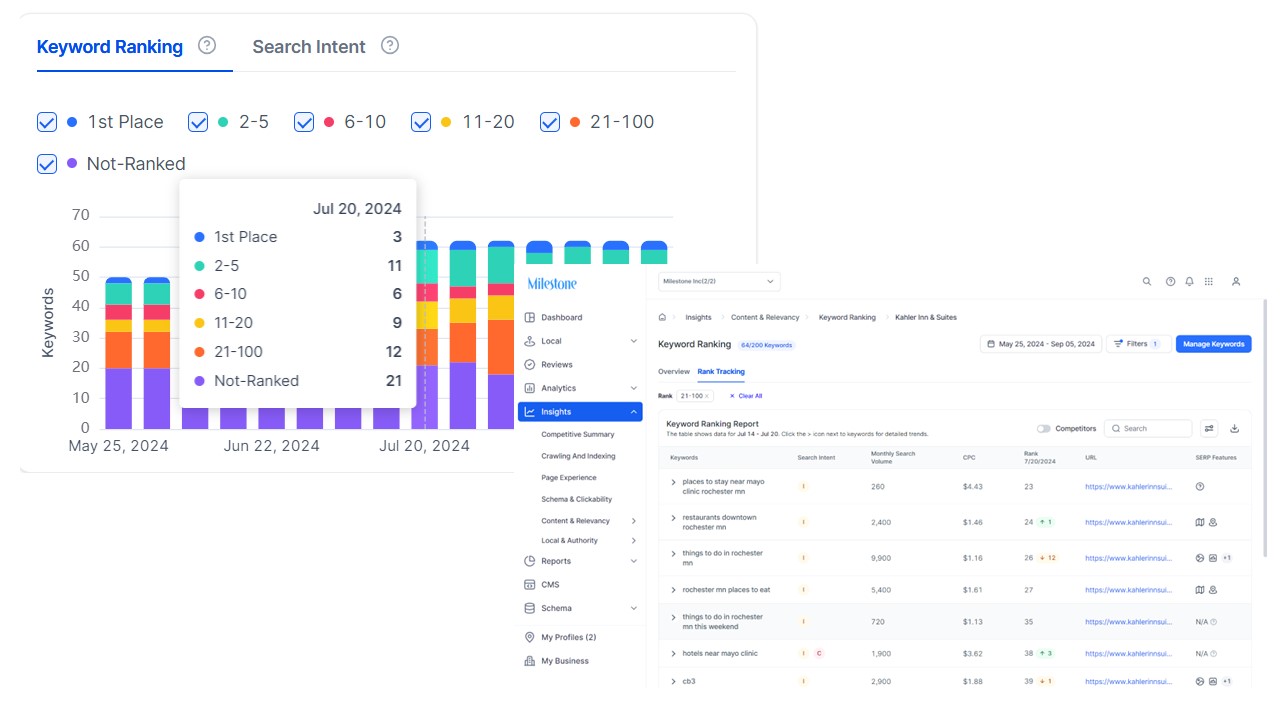
By clicking on a bar you can view detailed keyword data in the ‘Rank Tracking’ section.
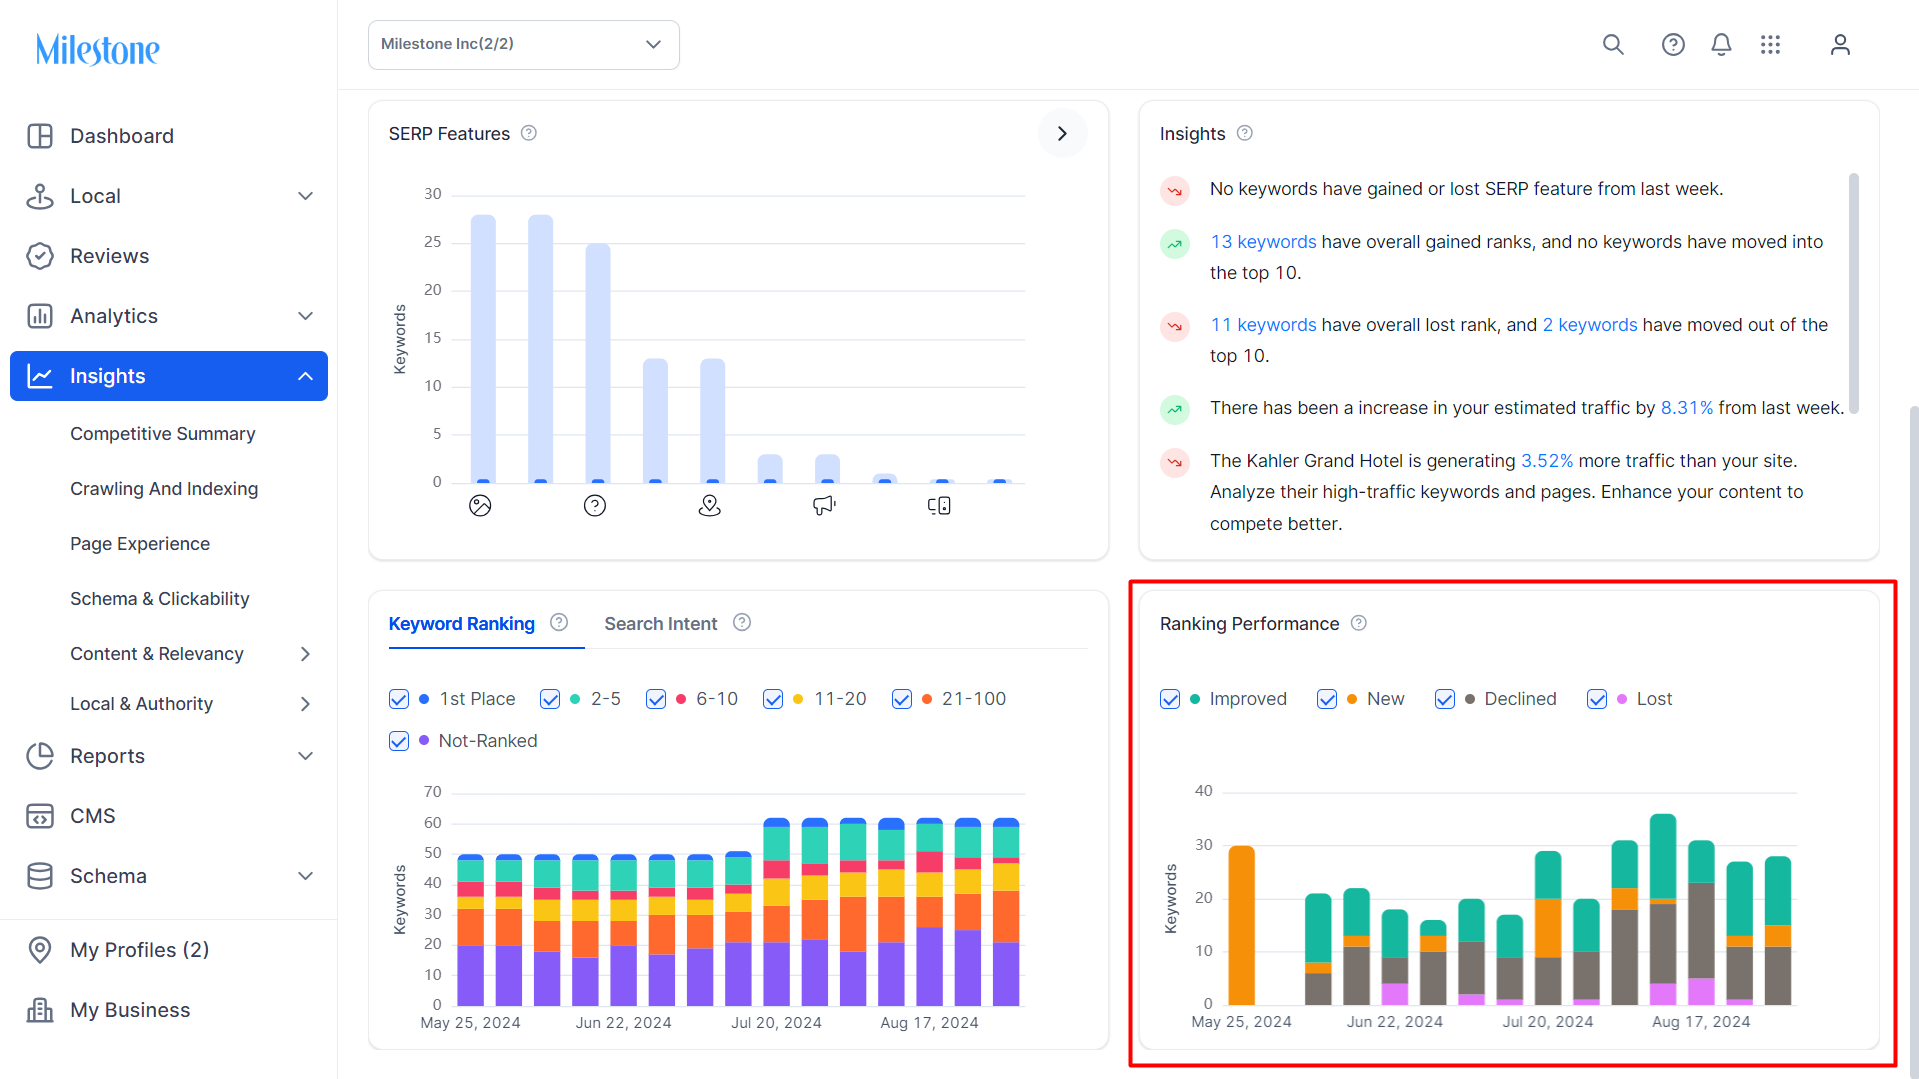
Ranking Performance
The Ranking Performance section displays how your keyword ranking has changed over a period.
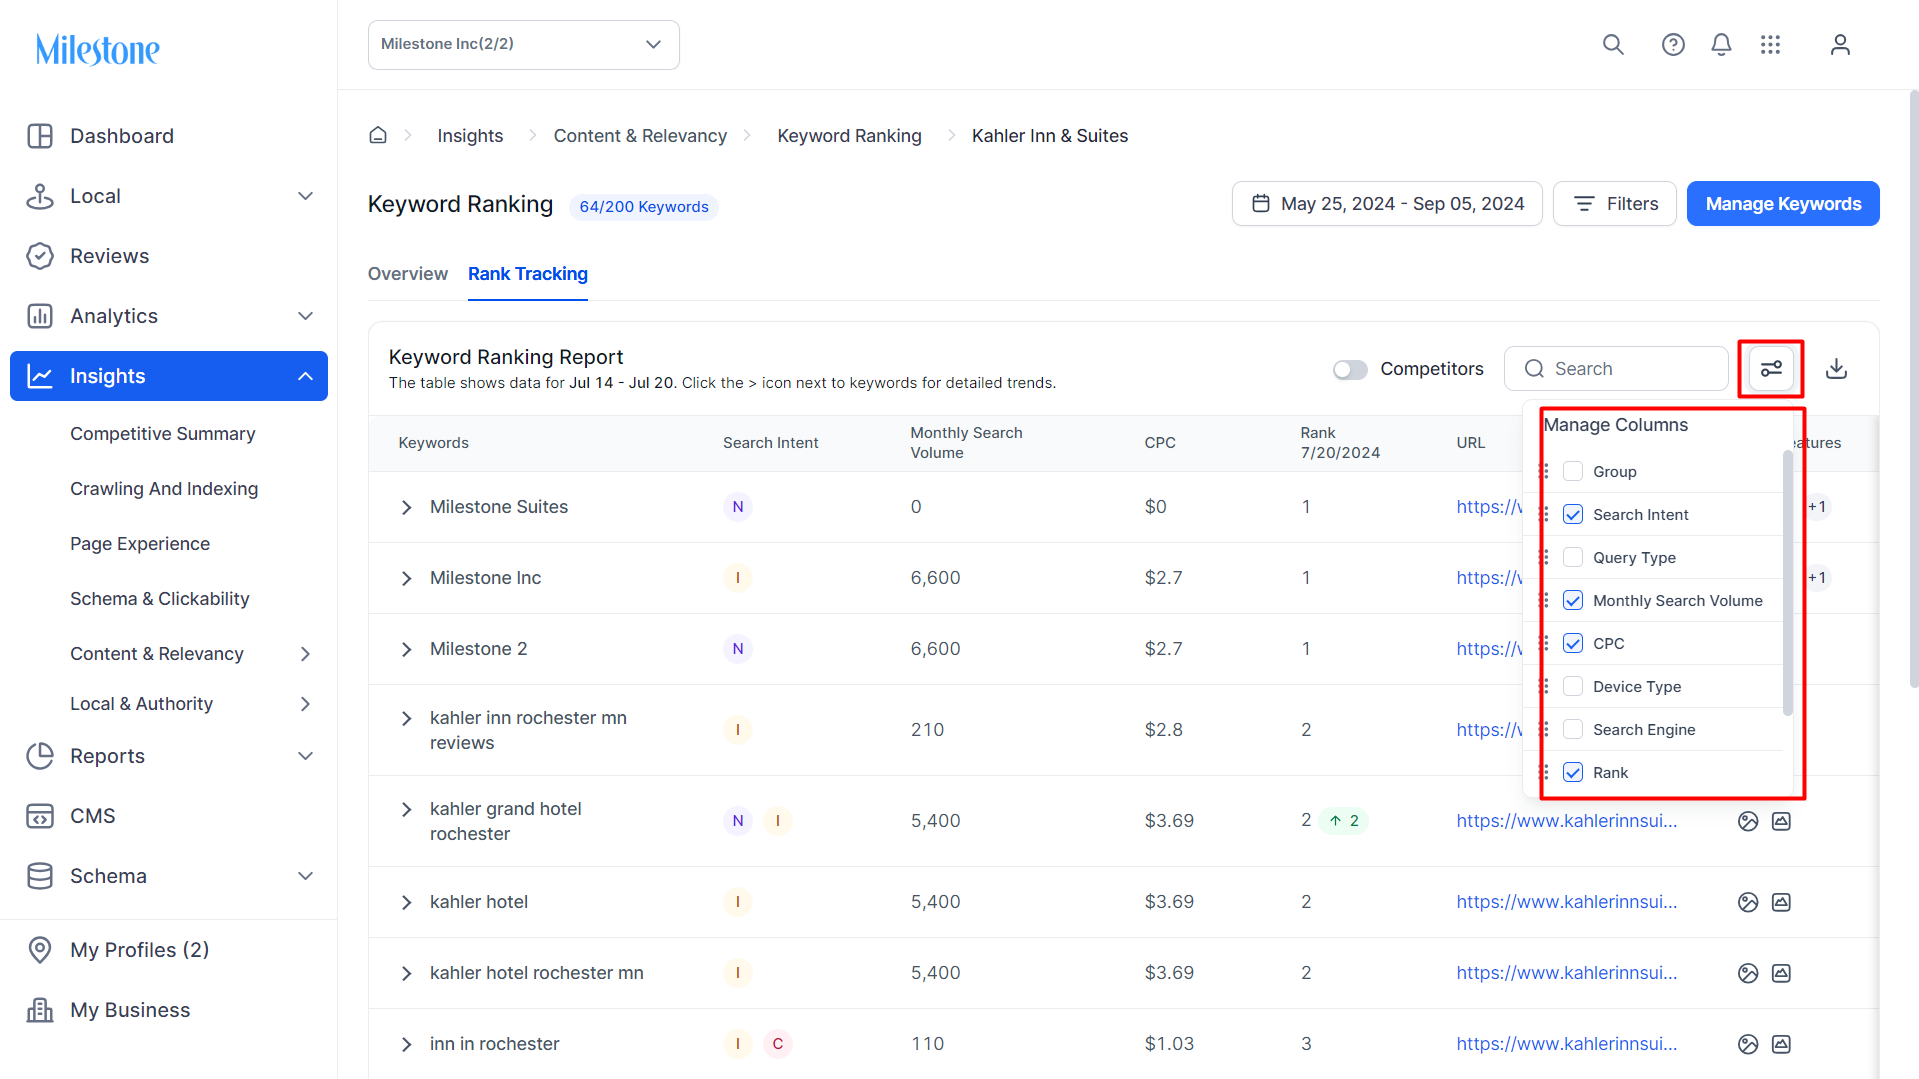
Rank Tracking
The ‘Rank Tracking’ section displays detailed data for your keywords. Here you can view the keywords, the search intent for which the keyword appears, the monthly search volume of the keyword, the CPC for the keyword, the ranking of your website for the keyword, the URL that is appearing on search, the SERP features that appear for the keyword.
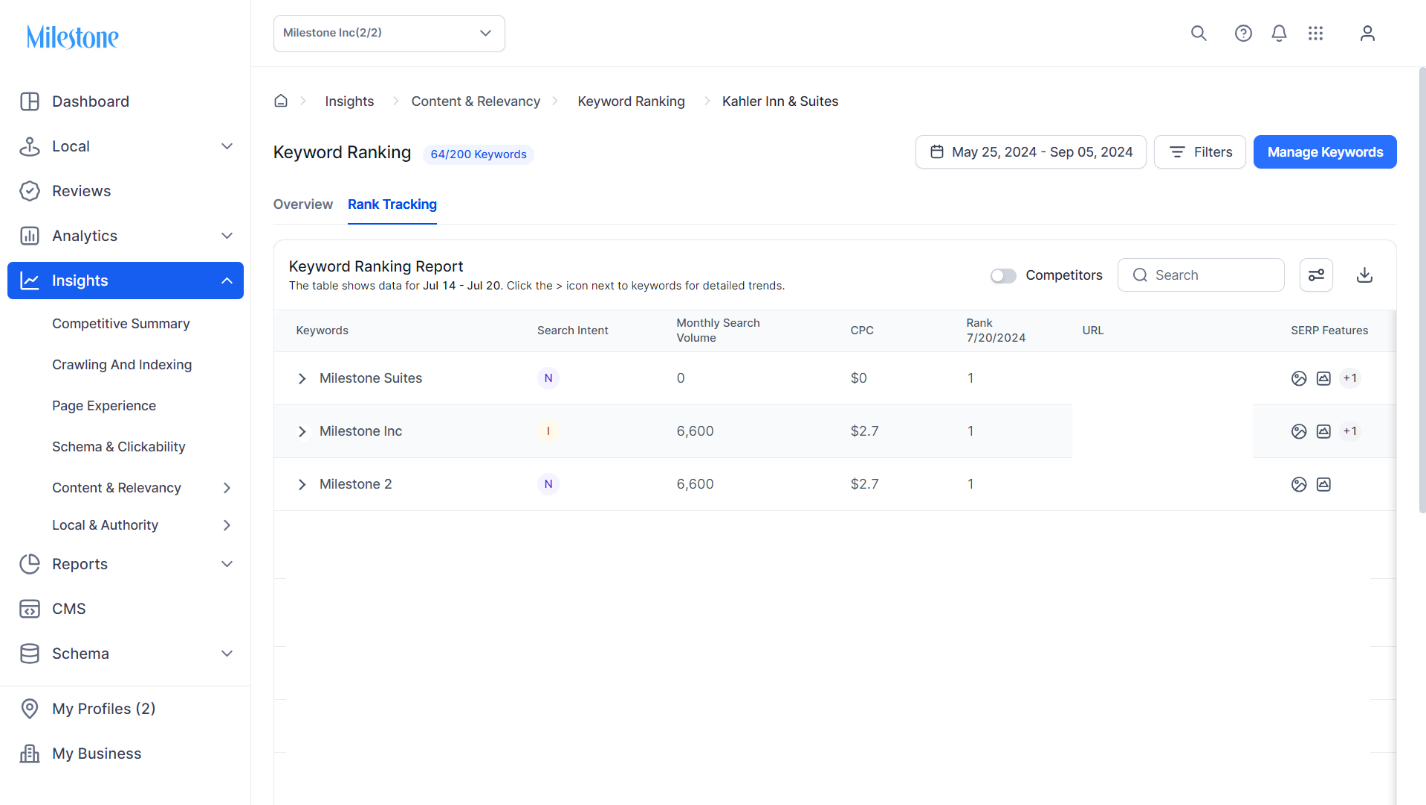
You can also add additional columns here using the ‘Manage Columns’ menu.
In conclusion, our revamped Keyword Ranking Report dashboard will bring a new level of functionality and usability to your reporting experience. By incorporating essential KPIs, detailed visualizations, and valuable client feedback, we aim to provide a more intuitive and competitive tool that enhances decision-making and drives engagement. We are committed to delivering a superior user experience that empowers you to gain insights more quickly and efficiently. Stay tuned for these exciting enhancements, designed to help you achieve your goals with greater ease and precision.