Glossary
Examples in UI/PDF
1. Scorecards
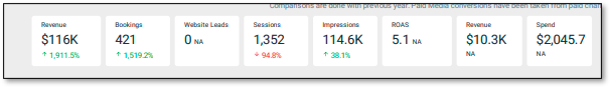
Show value of the metrics for the reporting month along with a comparison with the same month the previous year (YoY).
2. Scorecard (Paid Media)
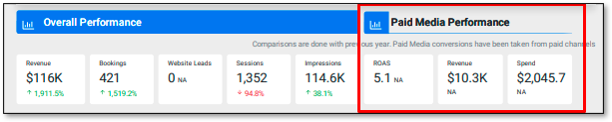
This section of the Overall Performance Scorecard shows the Paid Media channel performance. The Paid Media Performance section is displayed only when the client has active paid media campaigns, this information can be found in the last 3 columns of the Overall Performance Scorecard.
3. Monthly bar chart
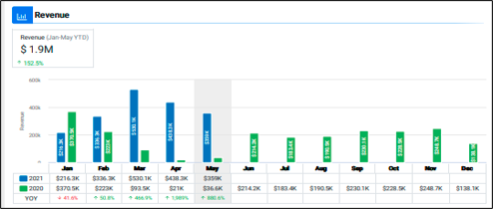
For a particular metric, this chart shows one bar for each month of the current year and all months of the previous year. The same months of the current and previous year are shown side by side for comparison purposes. It also shows the YTD (from Jan to reporting month) value of the metric on the top left. It also shows monthly data of the current and previous year in tabular format along with a YoY comparison. The current month bar and tabular data are highlighted in grey.
4. Horizontal stacked bar chart
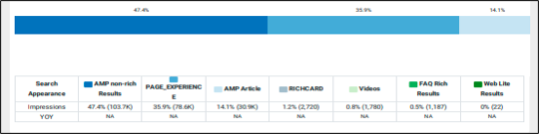
Shows the breakdown of the metric by one of its dimensions for the reporting month. This is presented as a divided bar laid out horizontally. It also shows a table underneath the chart showing the breakdown of the metric by its dimension.
5. Vertical Stacked bar chart
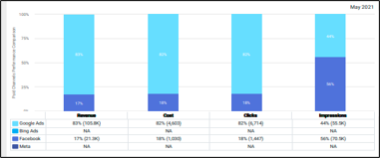
Shows the breakdown of multiple metrics and their contributing channels for the reporting month. This is presented as multiple vertical divided bars charts (one bar for each metric). The table below the chart shows the value of each metric for each channel in the selected reporting month.
6. Pie chart & Table
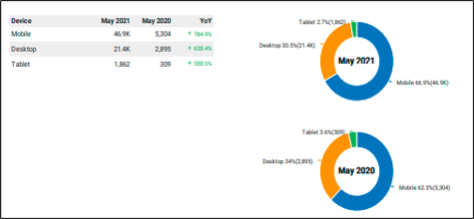
The breakdown of the metric is shown as a pie chart. The feature displays two pie charts, the pie chart on top represents the selected month and the pie chart below represents the corresponding month in the previous year. On the left are the numerical values of the variables.
Glossary:
Overall Performance | |||
Metric |
Widget Type |
Definition |
Source |
Revenue |
Scorecard, Monthly bar chart |
Total revenue generated on your website. |
Google Analytics |
Bookings |
Scorecard, Monthly bar chart |
Total number of successful transactions on your website. |
Google Analytics |
Hard Conversions |
Scorecard, Monthly bar chart |
Total number of user actions on the website indicating high interest in the service/product. This metric is shown only when Revenue data is not available. |
Google Analytics |
Website Leads |
Scorecard, Monthly bar chart |
Total number of leads generated from website; Leads count includes Clicks to Booking Engine Entrances, RFP Submissions, Phone Clicks, Contact Form Submissions, and Email Offer/Subscribe Submissions. |
Google Analytics |
Sessions |
Scorecard, Monthly bar chart |
Total number of times users visited your website. |
Google Analytics |
Impressions |
Scorecard |
The number of times any URL from your site appeared in search results viewed by a user for any of these channels: Local, Organic Search, Paid Search, Paid Social |
Across GSC, GMB and Paid platforms (Google Ads, Facebook, Bing and others) |
Revenue by Devices |
Pie Chart |
Shows Revenue generated on your website, segregated by device type (desktop or tablet or mobile) |
Google Analytics |
Revenue by Channels |
Horizontal stacked bar chart |
Shows Revenue generated on your website, segregated by marketing channels (Direct, Local, Organic Search, Paid Search etc.). We show top 6 channels and club any remaining channels under "Remain Channels". |
Google Analytics |
Hard Conversions By Channels |
Horizontal stacked bar chart |
Shows Hard Conversions actions on your website, segregated by marketing channels (Direct, Local, Organic, Paid, etc.). This metric is shown only when Revenue data is not available. We show the top 6 channels and club any remaining channels under "Remain Channels". |
Google Analytics |
Total Hard Conversions |
Table |
Shows the monthly breakdown for all months of the current year for different actions on the website constituting total Hard Conversions. |
Google Analytics |
Group Leads |
Monthly chart |
Shows total number of form submissions for group activities done on your website. This includes form submissions such as meeting/ Wedding RFP. This is shown only for accommodation vertical. |
Milestone CMS |
Overall Performance > Scorecard (Paid Media) | |||
Metric |
Widget |
Definition |
Source |
ROAS |
Scorecard (Paid Media) |
ROAS (Return on Ad. Spend) represents the revenue earned per amount spent on advertising. Shown only when there are active paid media campaigns |
Google Ads, Bing Ads, Facebook Ads, and Meta |
Revenue |
Scorecard (Paid Media) |
Total revenue gained from Paid Media: Google Ads, Bing Ads, Facebook Ads and Meta. Shown only when there are active paid media campaigns |
Google Ads, Bing Ads, Facebook Ads, and Meta |
Spend |
Scorecard (Paid Media) |
Amount spent on Paid Media campaigns. Shown only when there are active paid media campaigns |
Google Ads, Bing Ads, Facebook Ads, and Meta |
Leads |
Scorecard (Paid Media) |
Number of users who come via Paid ads and have completed a pre-defined goal on the website such as Form Fill-up, RFP Submission, Sharing Contact Info Form, Click to Booking Engine, and more. This metric is shown only when there are active paid media campaigns but Revenue cannot be booked from your website. |
Google Ads, Bing Ads, and Facebook Ads |
CPA (Leads) |
Scorecard (Paid Media) |
Cost per acquisition (CPA) is calculated as the cost divided by the number of leads generated on your website by users coming via Paid ads. This metric is shown only when there are active paid media campaigns but Revenue cannot be booked from your website. |
Google Ads, Bing Ads, Facebook Ads |
Paid Media Performance | |||
Metric |
Widget |
Definition |
Source |
ROAS |
Scorecard, Monthly bar chart |
Return On Advertising Spending represents the revenue earned per amount spent on advertising. |
Google Ads, Bing Ads, Facebook Ads or Meta |
Revenue |
Scorecard, Monthly bar chart |
Total revenue gained from Paid Media: Google Ads, Bing Ads, Facebook Ads and Meta. |
Google Ads, Bing Ads, Facebook Ads or Meta |
CPA |
Scorecard |
Cost per action (CPA) is calculated as the cost divided by the number of booking transactions done on your website when user comes via paid ads. |
Google Ads, Bing Ads, Facebook Ads or Meta |
Sessions |
Scorecard |
Number of times users visited your website through Paid Channel. |
Google Ads, Bing Ads, Facebook Ads |
Impressions |
Scorecard |
Number of times your Paid Media Ads were displayed in Search Engine results/Social platforms. |
Google Ads, Bing Ads, Facebook Ads or Meta |
Leads |
Scorecard, Monthly bar chart |
Number of users who have completed a pre-defined goal on the website such as Form Fill-up, RFP Submission, Sharing Contact Info Form, Click to Booking Engine and more when the user comes to the website via Paid ads. This metric is shown only when Revenue cannot be booked from your website. |
Google Ads, Bing Ads, Facebook Ads |
CPA (Leads) |
Scorecard |
Cost per acquisition (CPA) is calculated as the cost divided by the number of leads generated on your website by users coming via Paid channels. This metric is shown only when there are active paid media campaigns but Revenue cannot be booked from your website. |
Google Ads, Bing Ads, Facebook Ads |
Paid Channels Performance Comparison |
Vertical Stacked bar chart |
Shows comparison of different Paid channels for different metrics like Revenue or Leads, Cost, Clicks, and Impressions. Chart will show Leads when Revenue data cannot be booked from your website. |
Google Ads, Bing Ads, Facebook Ads or Meta |
Organic Performance | |||
Metric |
Widget |
Definition |
Source |
Revenue |
Scorecard, Monthly bar chart |
Total revenue generated on your website by users accessing the site from unpaid (or “organic”) search results on Google, Bing, Yahoo and other search engines |
Google Analytics |
Bookings |
Scorecard |
Total number of successful online transactions done by users accessing the site from unpaid (or “organic”) search results on Google, Bing, Yahoo and other search engines |
Google Analytics |
Website Leads |
Scorecard |
Total number of Website leads generated from the website by users accessing the site from unpaid (or “organic”) search results on Google, Bing, Yahoo, and other search engines |
Google Analytics |
Sessions |
Scorecard, Monthly bar chart |
Number of times users visited your website from unpaid (or “organic”) search results on Google, Bing, Yahoo, and other search engines |
Google Analytics |
CTR |
Scorecard |
Click-through rate (calculated as Clicks / Impressions * 100) is the percentage of users who click on your website URL from a Search results page, not including clicks on paid search results |
Google Search Console |
Impressions |
Scorecard, Monthly bar chart |
The number of times any URL from your site appeared in search results viewed by a user, not including paid ads search impressions |
Google Search Console |
Rich Results |
Horizontal stacked bar chart |
Shows breakdown of Impressions by Rich result type which are designed to highlight key information and help search engines understand a page’s purpose as accurately as possible. The sum of all Rich Result type impressions may not match total organic impressions because Google does not assign Rich Result type to all impressions. |
Google Search Console |
Local Performance | |||
Metric |
Widget |
Definition |
Source |
Revenue |
Scorecard |
Total revenue generated on your website by users accessing the site from business listings on Google, Bing, Facebook, and Foursquare |
Google Analytics |
Bookings |
Scorecard |
Total number of successful online transactions done by users accessing the site from business listings on Google, Bing, Facebook and Foursquare |
Google Analytics |
Website Leads |
Scorecard |
Total number of Website leads generated from the website by users accessing the site from business listings on Google, Bing, Facebook and Foursquare |
Google Analytics |
Sessions |
Scorecard |
Number of times users visited your website from business listings on Google, Bing, Facebook, and Foursquare |
Google Analytics |
Impressions |
Scorecard, Monthly bar chart |
The number of times any business listing appeared in search results/ maps viewed by a user |
GMB and Bing |
Customer Actions |
Scorecard, Monthly bar chart |
Shows the sum of Call You, Request Directions, Visit to Website from Google and Yelp listings |
GMB and Yelp |
Performance Across Channels |
Vertical Stacked bar chart |
Shows comparison of Google, Bing and Yelp listings for different metrics like Impressions, Visits to Website, Request Directions and Call You. |
GMB, Bing and Yelp |
Audience Overview | |||
Metric |
Widget |
Definition |
Source |
Sessions By Channel |
Pie chart & Table |
Shows breakdown of Sessions by Channels |
Google Analytics |
Sessions By Device Type |
Pie chart & Table |
Shows breakdown of Sessions by Device types like mobile, tablet or desktop for different users |
Google Analytics |
Sessions By Gender |
Pie chart & Table |
Shows the number of times users of certain type (male/female) visited your website. Note: Demographic data is only available for a subset of users and may not represent, and may not represent the overall composition of traffic. |
Google Analytics |
Sessions By Geography (Top 10 Cities) |
Pie chart & Table |
Shows breakdown of Sessions by Geography for the top 10 cities |
Google Analytics |