Content Intelligence Dashboard
Let's introduce you to the Content Intelligence Dashboard and the key elements that you need to be aware of.
Profile selection
Using the profile drop-down, you can switch between profiles that you are mapped to.
![]()
Once on the dashboard, you have the option of viewing data and topics based on the options you choose – New, Competitive, Rich Results.
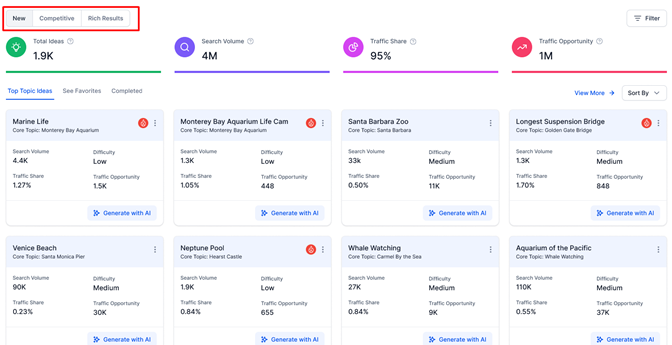
- New – Fresh content that you wish to talk about that is yet to be covered by you or your competition.
- Competitive – Topics that your competitors are talking about and content gaps or topics you can use as an opportunity.
- Rich Results – Topics that your competitors are ranking for as rich results on search – basically in line with Google’s helpful content.
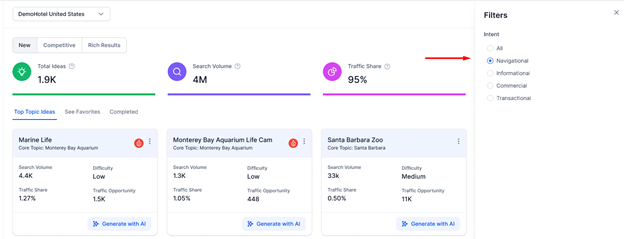
You’ll notice that switching between the filters will change the data and topic suggestions.
Select the filters based on conversation intent. This will further filter topics based on your selection.
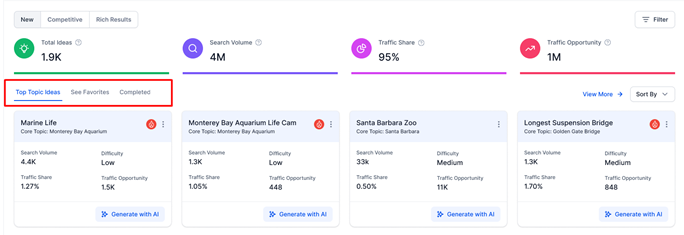
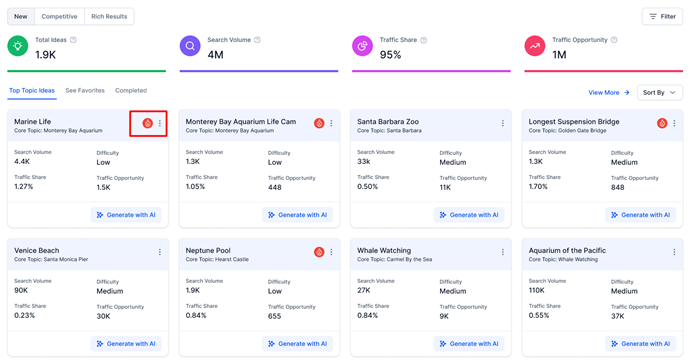
Once you’ve chosen an option and used your conversation filter you will see the key opportunity indicators at the top – Topic Ideas, SearchVolume, Traffic Share, and Traffic Opportunity.
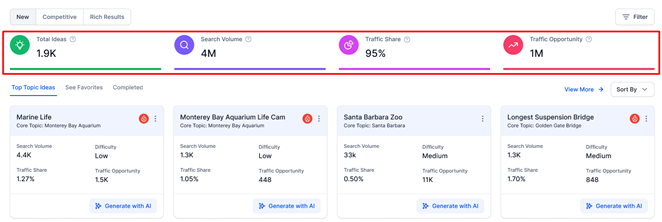
- Topic Ideas – Number of topics that you can talk about to drive search visibility
- Search Volume – Total monthly search volume of keywords across all topic ideas
- Traffic share – The percentage of traffic that your website can achieve, based on the total visits to all competitor websites
- Traffic Opportunity – Potential reach of all topics for your business against your competitors
Further down, you can drill down into topics that are TopicIdeas which are topics we’re suggesting that you start writing on, Favorite Topics that you’ve chosen to ‘Add as Favorites’ under ‘See Favorites’, and topics that have already been covered under ‘Completed’ that you’ve marked as ‘Done’.
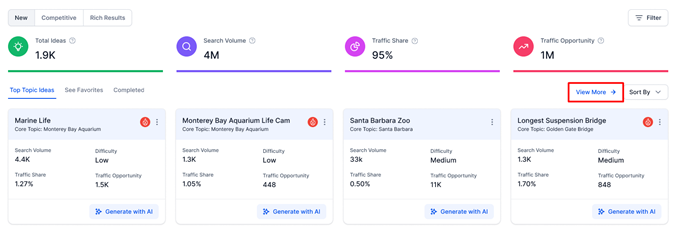
Clicking on ‘View More’ will give you a list of topics that you can cover.
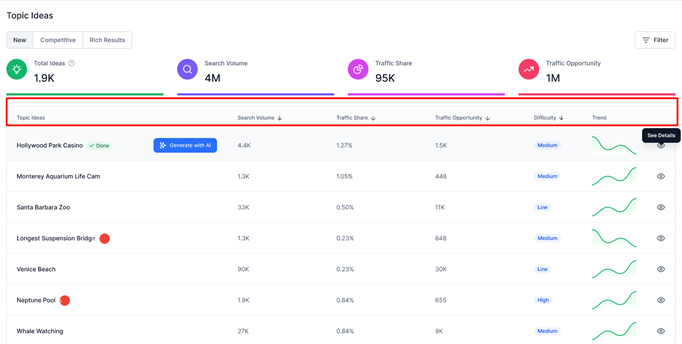
Here, for each topic, you will see the search volume, traffic share and opportunity, difficulty in terms of chances of ranking high, and the current trend of the topic on search.
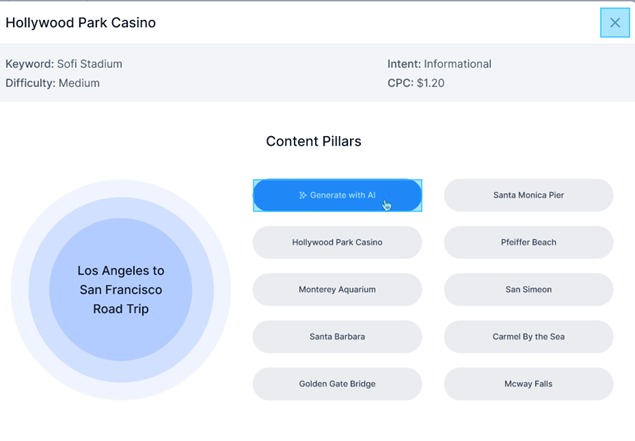
By clicking on ’See Details’, you will see the core topic (in this case – Los Angeles to San Francisco Road Trip) and the content pillars or subtopics that you can create content that links to the core topic. For the chosen topic, you will also see the keyword, intent, difficulty, and cost per click if you had to bid for the keyword for a paid campaign.
Back on the dashboard, you can also sort your topic cards based on Search Volume and Traffic Share.
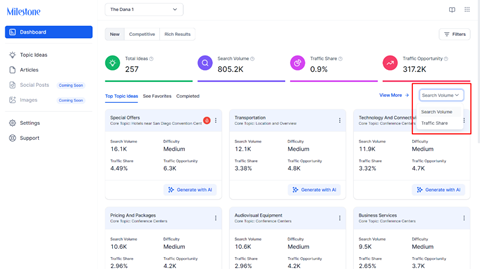
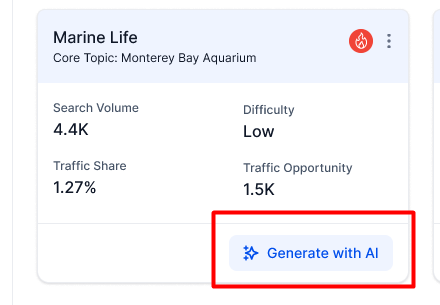
Against the topic panel, you will indicators such as this. Red signifies that the topic is trending.
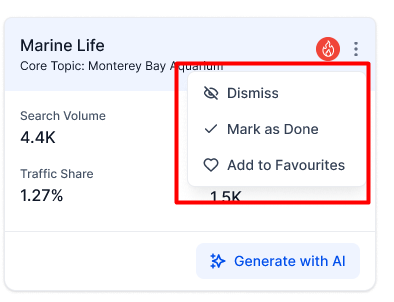
By clicking on the 3-dots, you have the option to carry out functions such as dismiss (the topic), mark as done, Add to Favorites. This will segregate your topics under the filters ‘See Favorites’ and ‘Completed’.
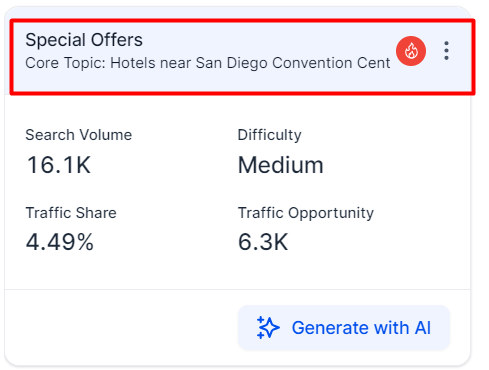
Also, on each topic card, you’ll see the topic name (or pillar) and its link to the core topic.
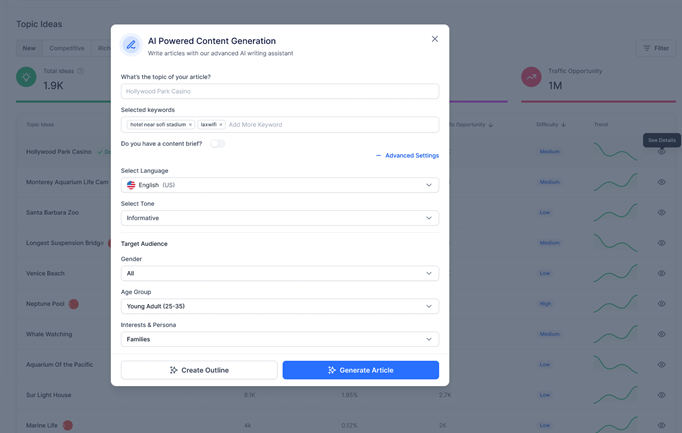
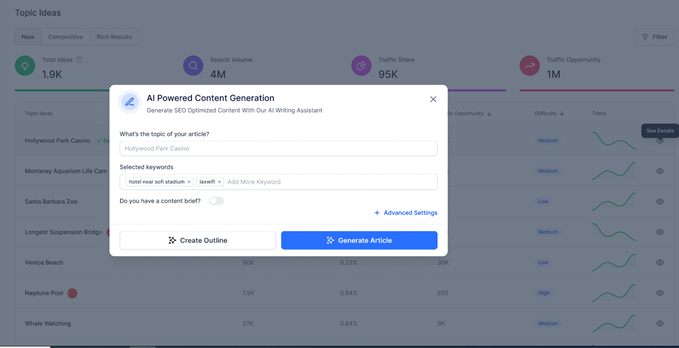
To generate an article based on the recommended topics, click on ‘Generate with AI’.
On the popup, you will see the topic of the article and keywords auto-populated. Choose whether you have a content brief, and then select if you wish to create a content outline or generate a complete article.
By clicking on ’Advanced Settings’, you will see all the details such as language, tone, and target audience that are auto-populated based on the settings you have chosen. For this particular article, you can choose to alter the settings using the dropdowns.
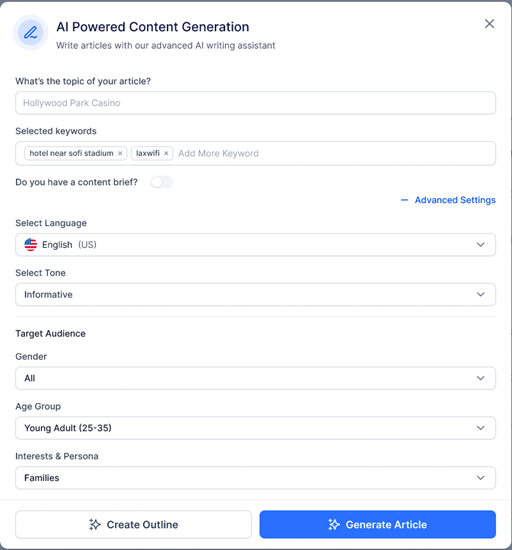
You can choose to create an outline that contains headers and bullet points, or you can generate a complete article using AI. To know how to use the editor with SEO recommendations, click here.