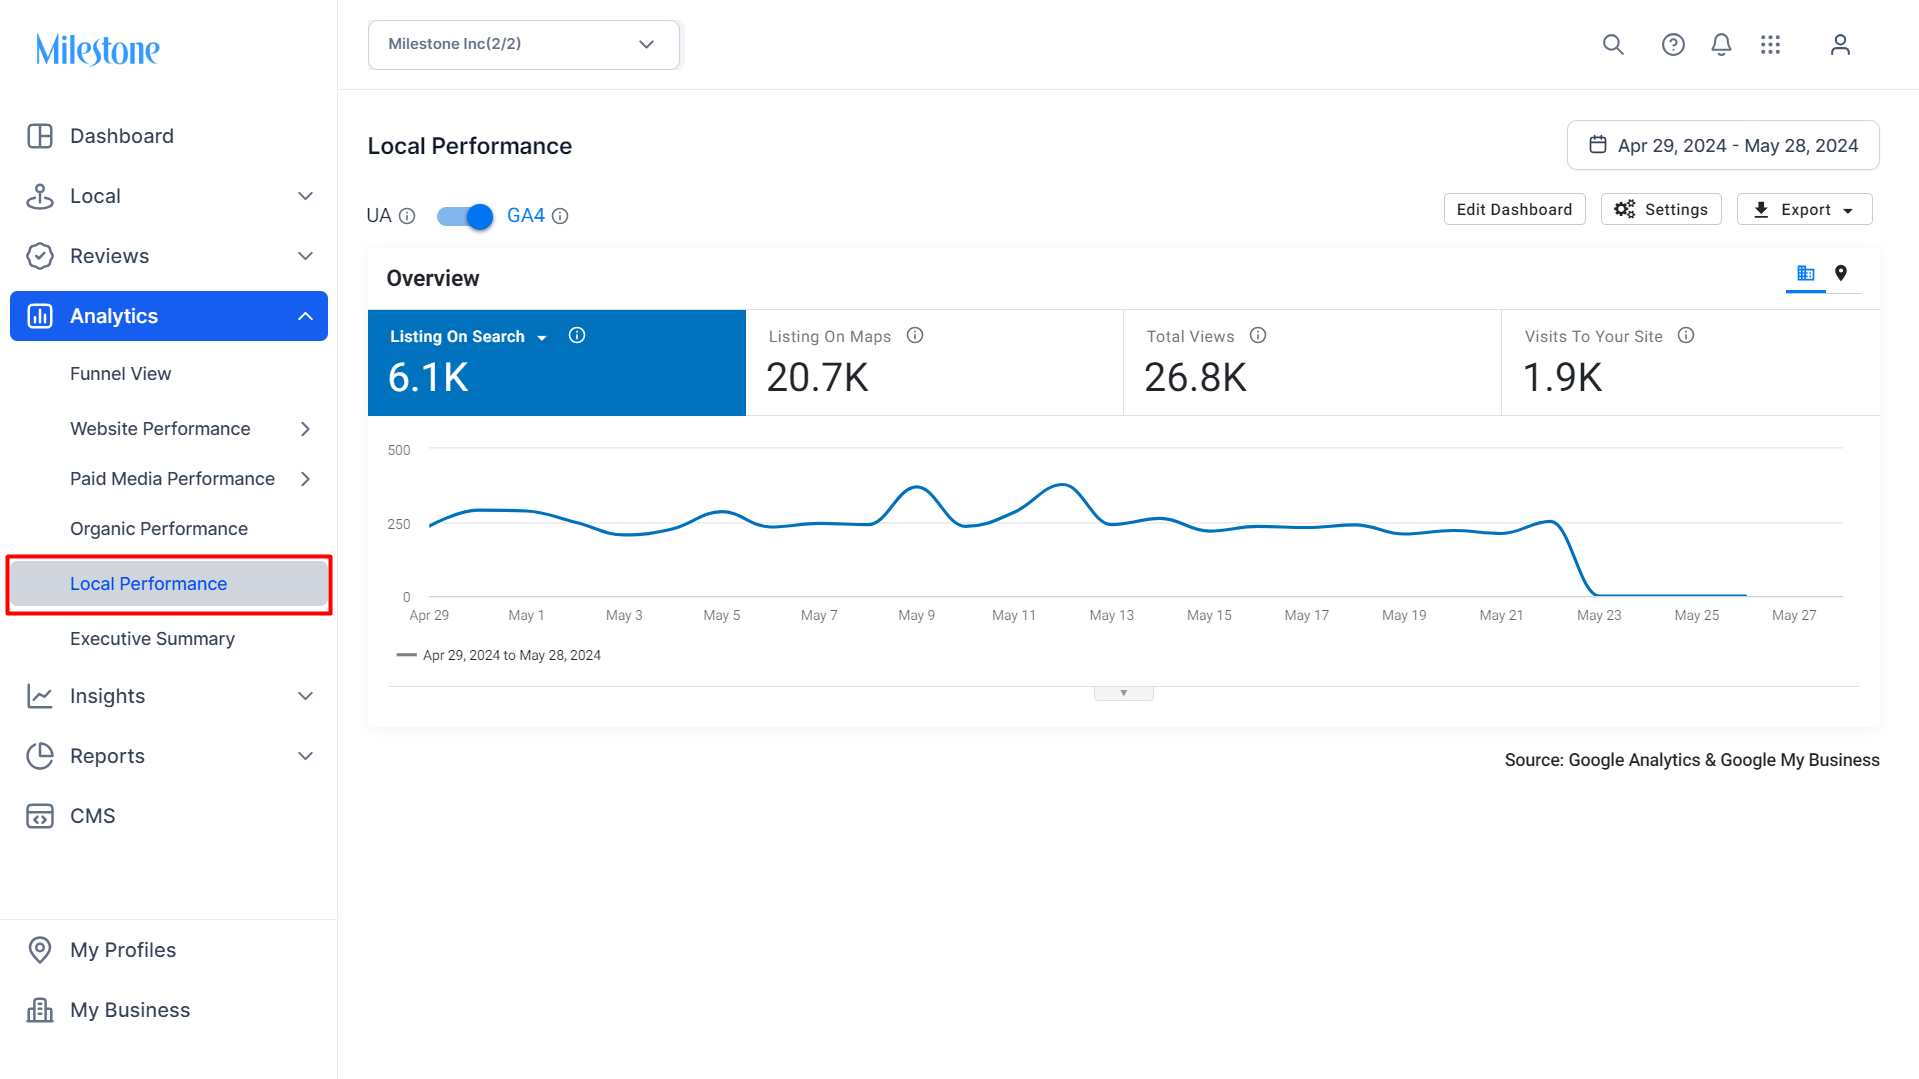
Local Performance Overview
The Analytics Local tab displays the local performance of your website. It displays key performance indicators (KPIs) such as direct traffic to your website, number of non-branded keywords of your website that were clicked, total time your website was found on search engines, visits to your websites, number of times users clicked on the request for directions to your property and number of time users clicked on the ‘Call You’ button to get in touch with your business to answer a query or make a booking.
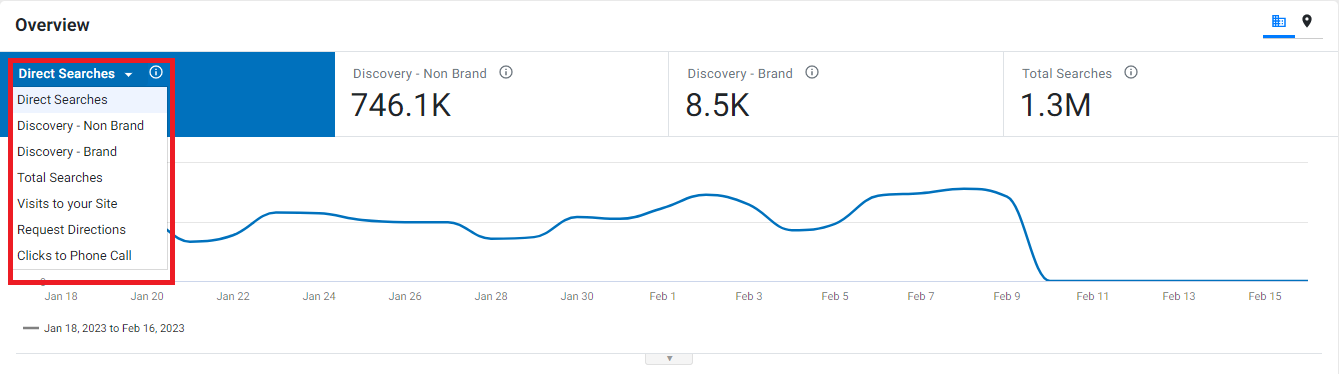
To switch KPIs, click on the scorecard tile and select a KPI that will be displayed on the trend graph.
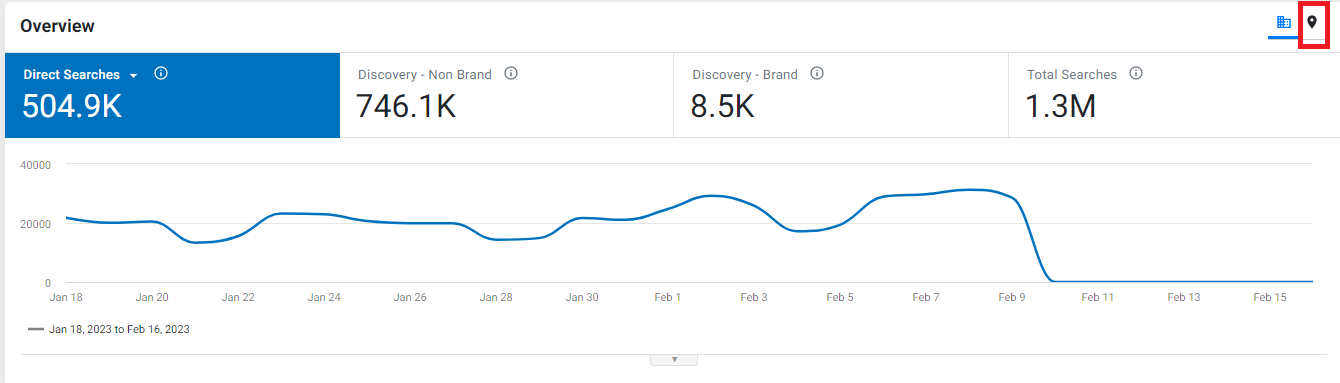
Click on the location button to view the data for every location. Use the 'Columns' drop-down to choose the KPIs you wish to see.
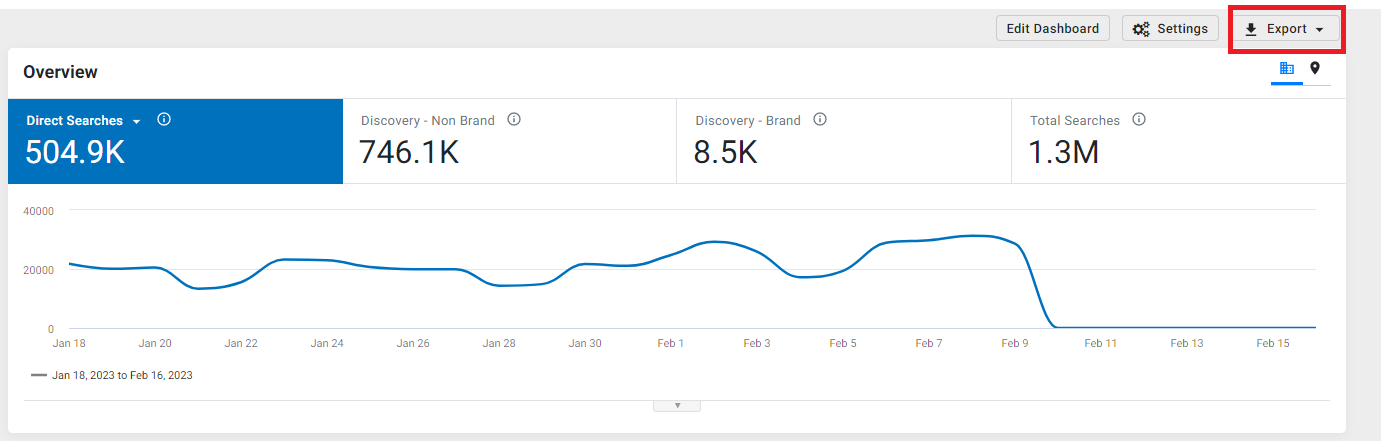
Click on the 'Export' button to export the data on an excel.