Release: Sept 1, 2022
Updates to Milestone FAQ Manager, Insights, Schema Manager and Analytics
FAQ Manager
Add images from Digital Asset Library
Opportunity: Adding optimized images to your FAQs canprovide readers better context to your answers and improve visibility onsearch. A centralized repository that optimizes images for search can greatlyimprove FAQ performance on search.
Solution: Add images to FAQs on Milestone FAQ Managerusing Milestone Digital Asset Library, that optimizes and stores images forsearch from the get-go.
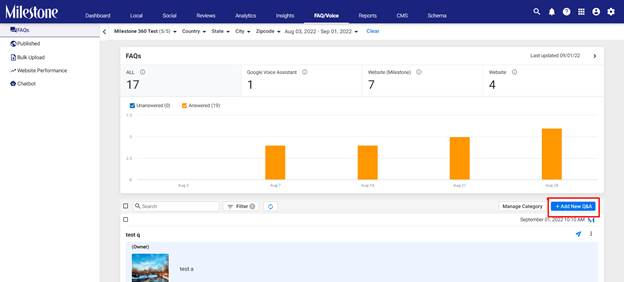
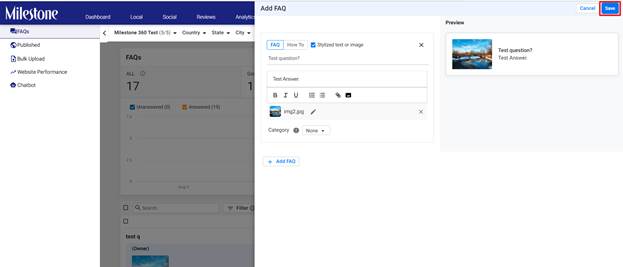
Path: FAQ/Voice > Add New FAQ
Step 1: From the FAQ/Voice section click on ‘Add NewQ&A’
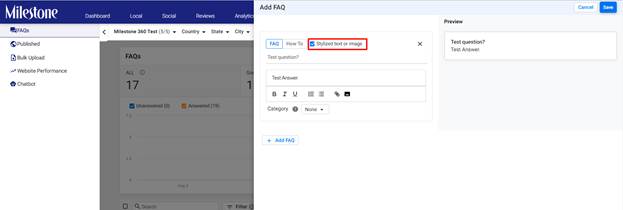
Step 2: Once you have added the question and answerin this section click on ‘Stylized text or image’ to the top
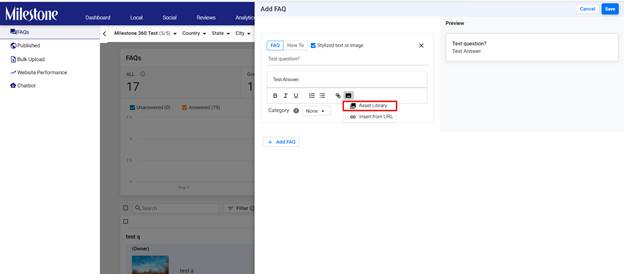
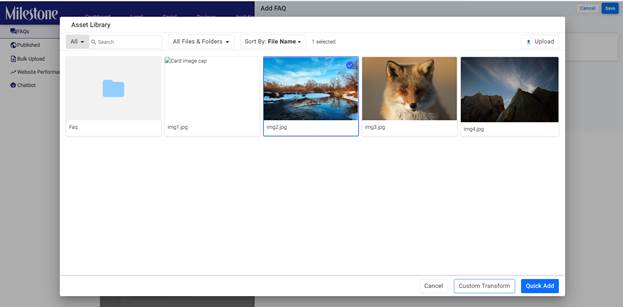
Step 3: From the options to the bottom click on theimage icon and select ‘Asset Library’ to access your centralized asset library
Step 4: From the Asset Library select the images youwish to add to the Q&A
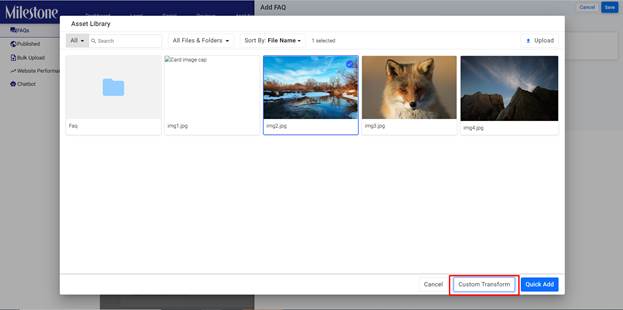
Step 5: If you wish to resize the image click on‘Custom Transform’ to the bottom
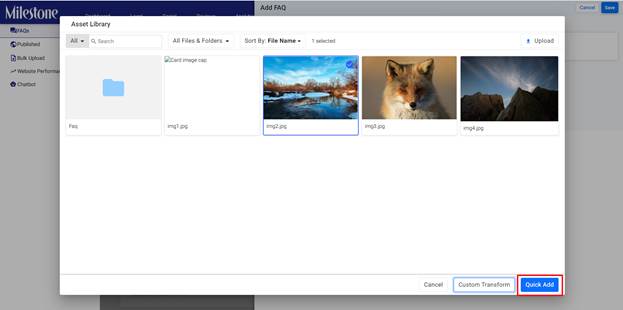
Step 6: If you wish to add the image without anyedits click on ‘Quick Add’
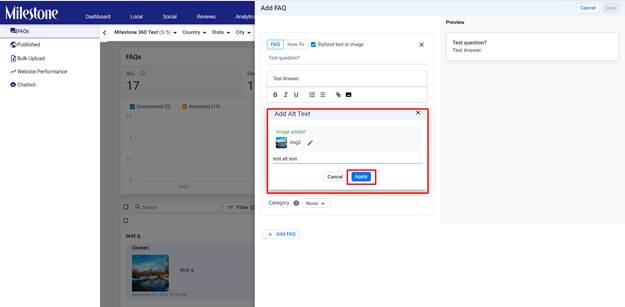
Step 7: Add the ‘Alt text’ for the image and click on‘Apply’
Step 8: Click on ‘Save’ to save the Q&A to FAQManager
Insights
New UI for Content in the Local & Authority section
The new Content User Interface in Milestone Insights allowsyou to quickly scroll through insights into the performance of your content withnew tabs and widgets that are easy to read.
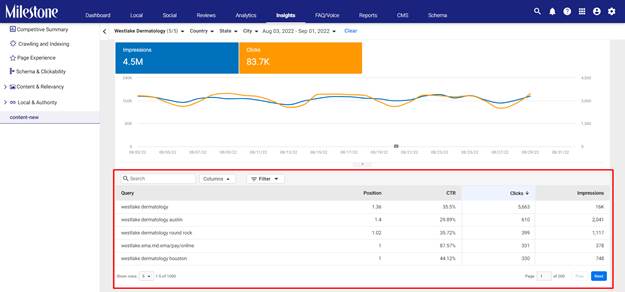
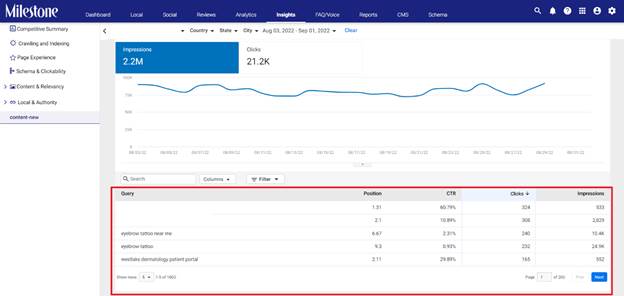
Search Traffic Overview
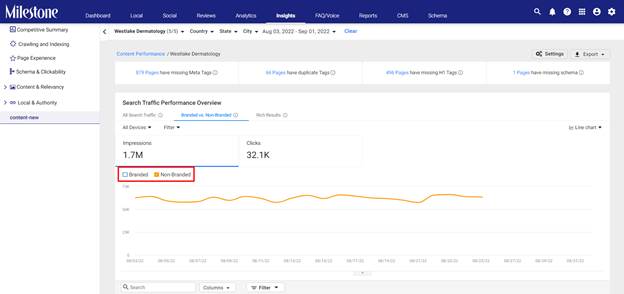
The Search Traffic Overview provides insights on theperformance of your content in terms of click and impressions for All SearchTraffic, Branded vs Non-branded searches and Rich Results.
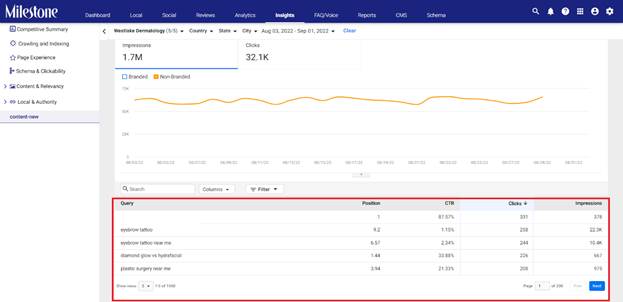
The ‘All Search Traffic’ tab displays all queries that yourwebsite appeared on
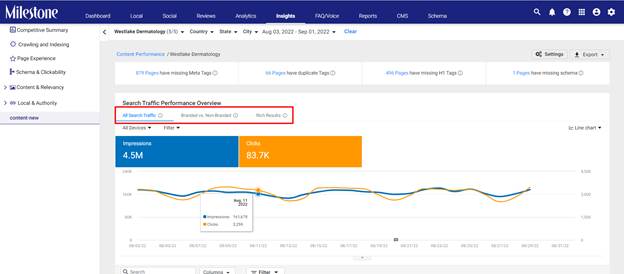
The table below the chart displays the specific queries forwhich your website appeared.
The ‘Branded vs Non-branded’ tab displays a comparativegraph of the click and impressions generated by branded and non-brandedsearches.
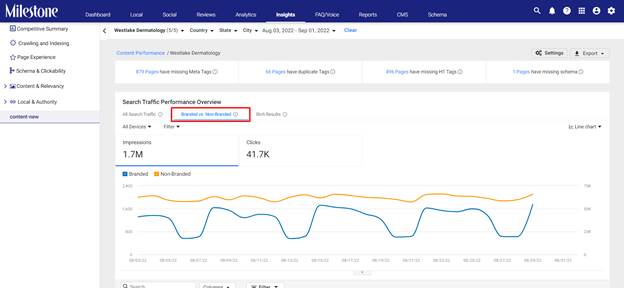
You can select data for branded or non-branded searches byselecting or deselecting them from the top of the graph.
The table below the chart displays the queries for the datatype selected in the chart
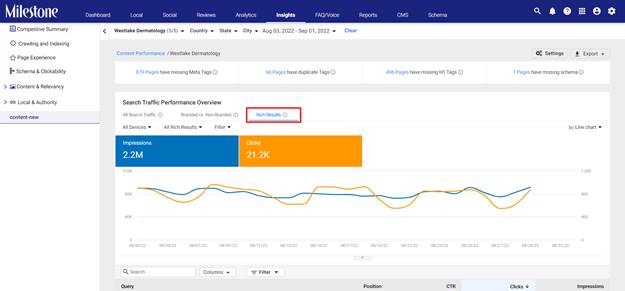
The ‘Rich Results’ tab displays the clicks and impressionson rich results for which your website content is displayed.
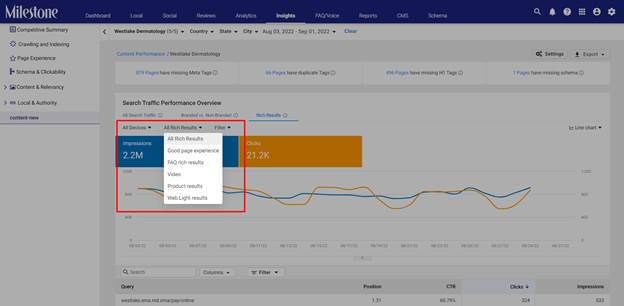
You can use the dropdown menus to the top of the chart tofilter the results by devices, the types of rich results triggered, and otherfilters to narrow down specific data
The table below the chart displays the queries which triggerrich results on searches
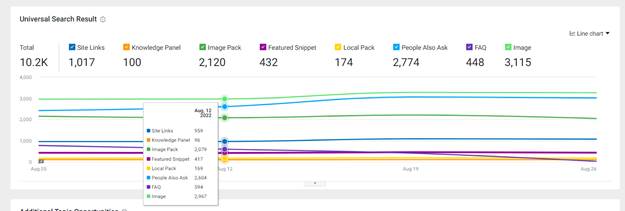
Universal Search Results
The Universal Search Results tab displays the type of searchresults that keywords have triggered from your website and their volumes
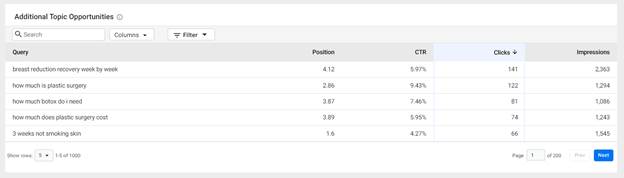
Additional Topic Opportunities
The Additional Topic Opportunities section displays other keywords that your website can possibly perform well for and their clicks and impressions derived from Google Search Console
Schema
Additional X-Paths
Opportunity: While bulk publishing schemas to multiple pages there might be variations in the x-path for grouped schema, this variation in x-paths can cause an error while publishing schema on pages.
Solution: Add multiple x-paths to a single schema to ensure it is published seamlessly across pages and schema groups.
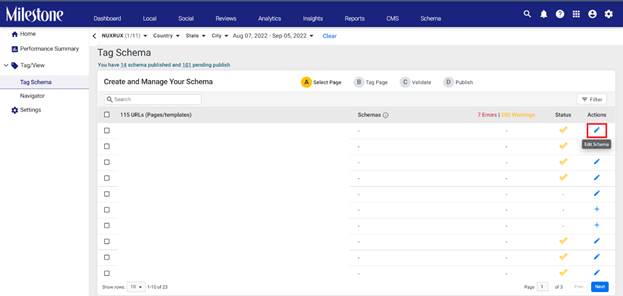
Path: Schema Manager > Tag Schema
Step 1: From the Schema Manager homepage click on‘Tag Schema’ in the ‘Tag/View’ section within the left navigation bar
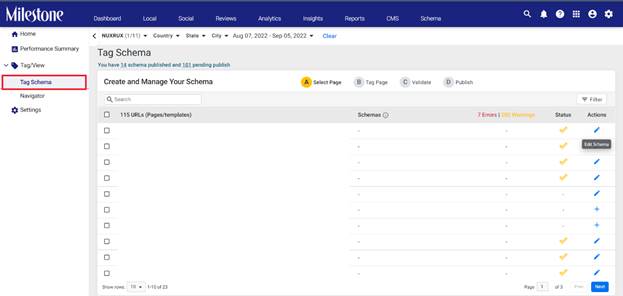
Step 2: Click on the edit icon corresponding to the page you wish to update the schema and its properties for
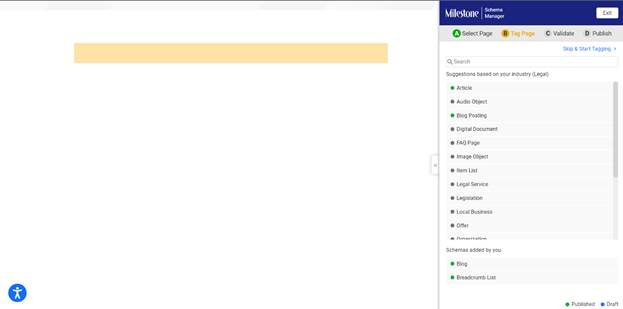
Step 3: You will be redirected to the selected page to edit schema with Milestone Schema Manager
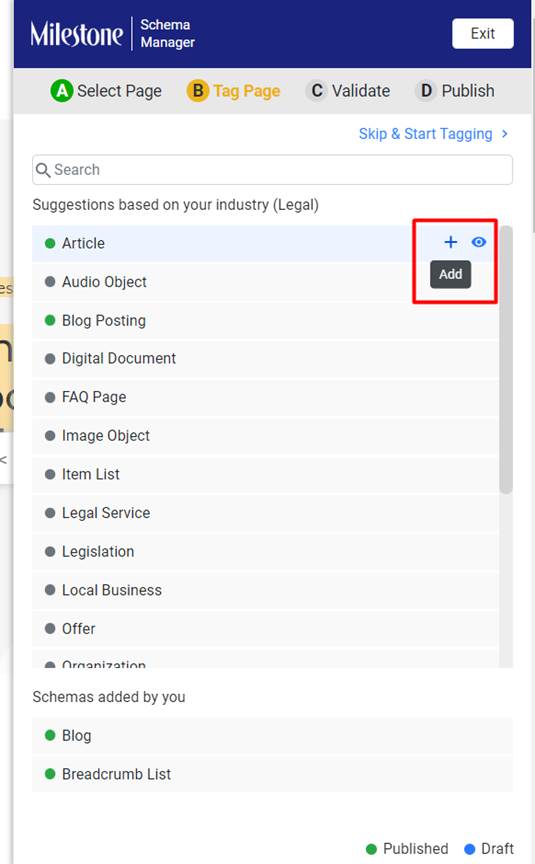
Step 4: Click on the add icon corresponding to the schema type for which you wish to include an additional x-path
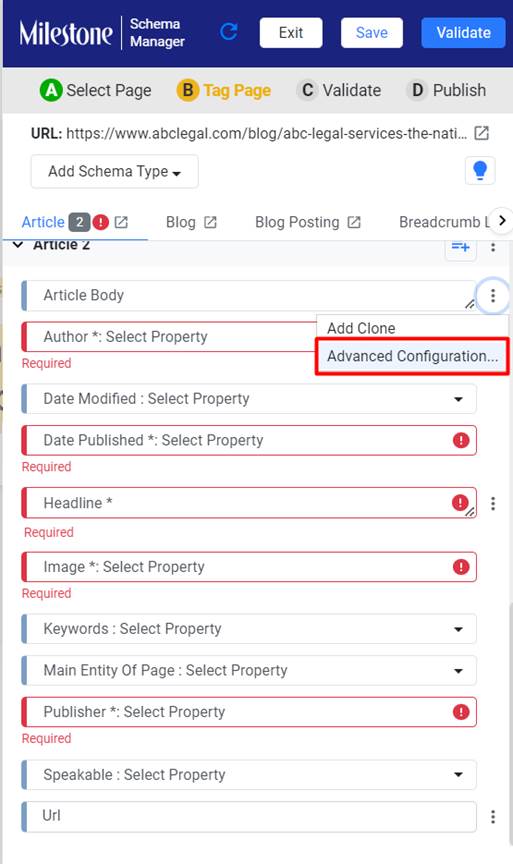
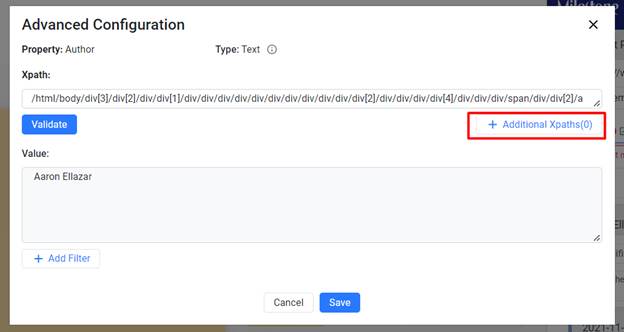
Step 5: Click on the three-dot menu corresponding to the element you wish to include an additional x-path for and select ‘Advanced Configuration’
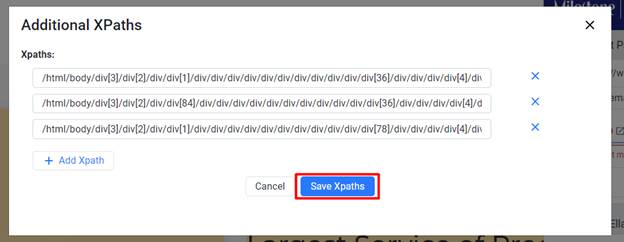
Step 6: Click on the ‘Additional Xpaths’ button to update an additional Xpath
Step 7: Once you have updated the additional Xpathsclick on ‘Save Xpaths’
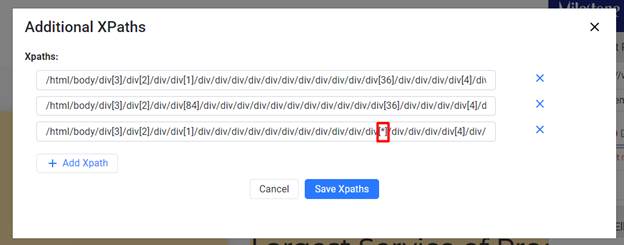
Step 8: If you wish to add all variables for a specific portion of the Xpath add an ‘*’ in place of the variable
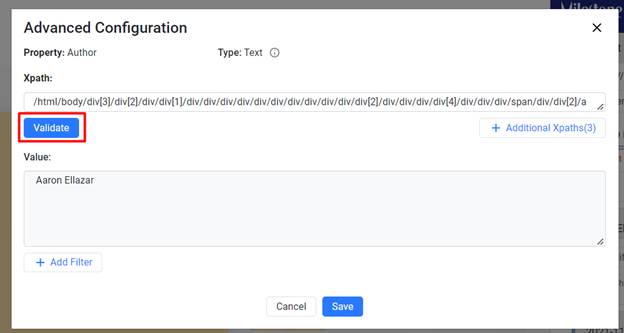
Step 9: Once all the Xpath for the element have been saved you can validate all Xpaths by clicking on ‘Validate’
Analytics
Form Leads Breakdown
Opportunity: Understanding what your customers are looking for can provide you insights into customer needs and behavior. Viewing Form Leads for specific products or services offered by you provides you a bird’s eye view of customer behaviors.
Solution: Milestone Analytics allows automotive customers to breakdown Form Leads data by product or service in a simple to understand chart.
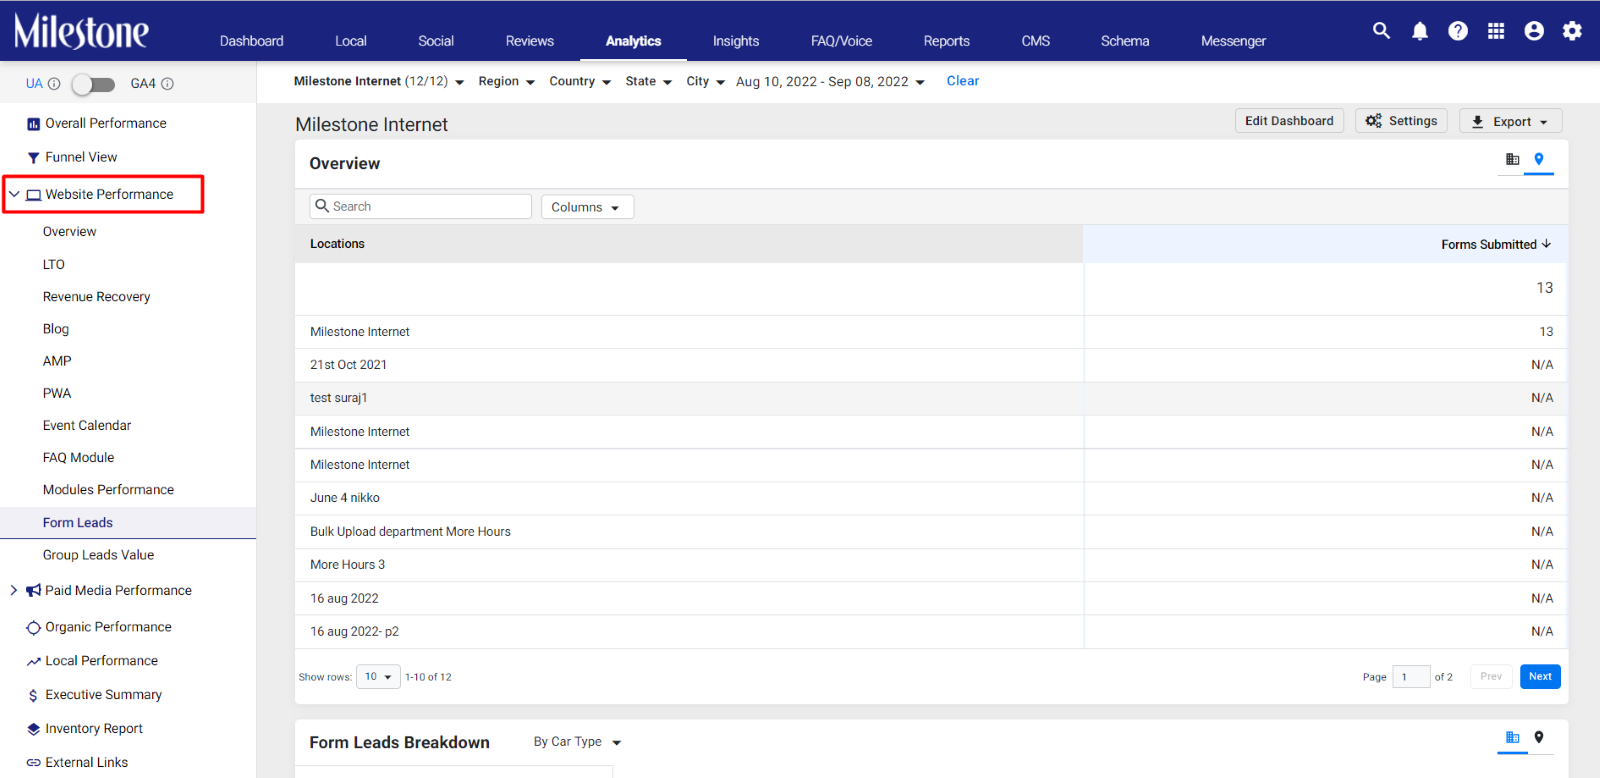
Path: Milestone Analytics > Website Performance > Form Leads
Step 1: Click on ‘Website Performance’ in the left navigation panel of Milestone Analytics
Step 2: Select ‘Form Leads’ from the expanded menu
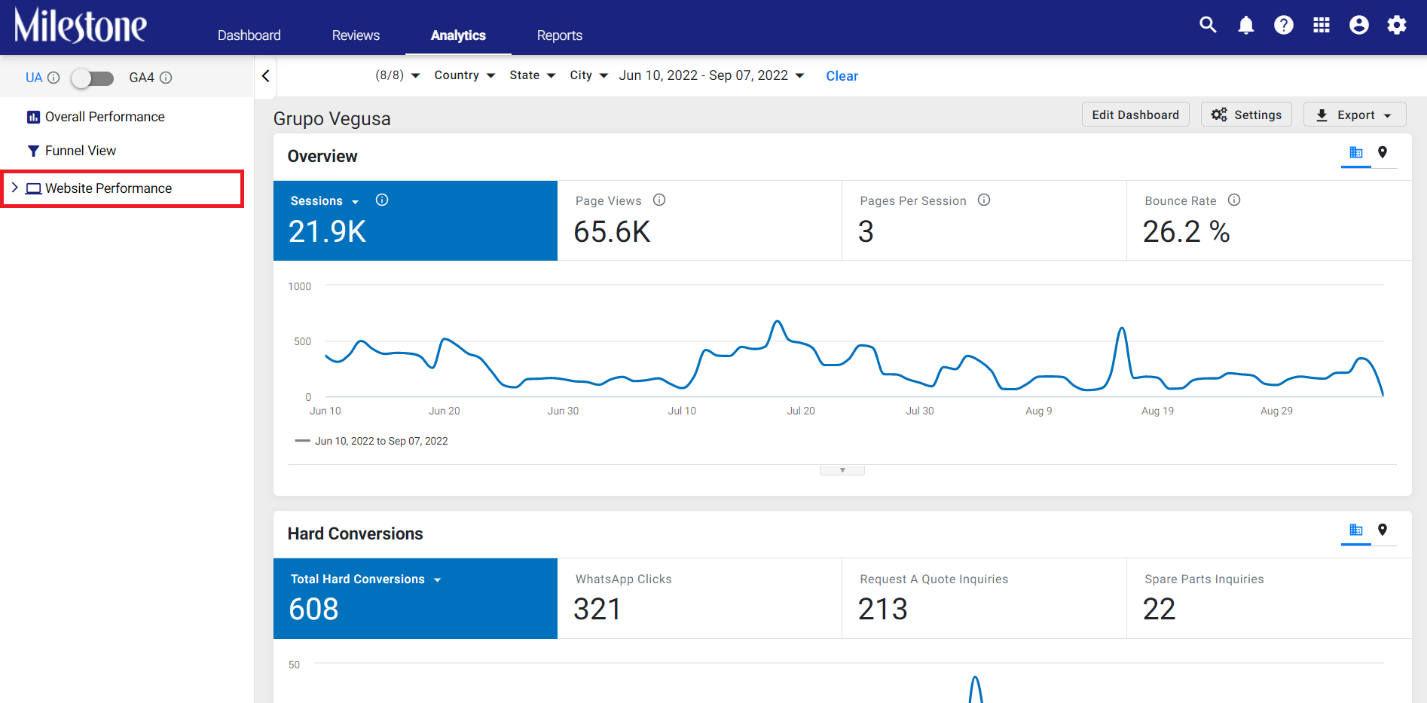
The Overview chart provides a chronological view of the total number of form submissions
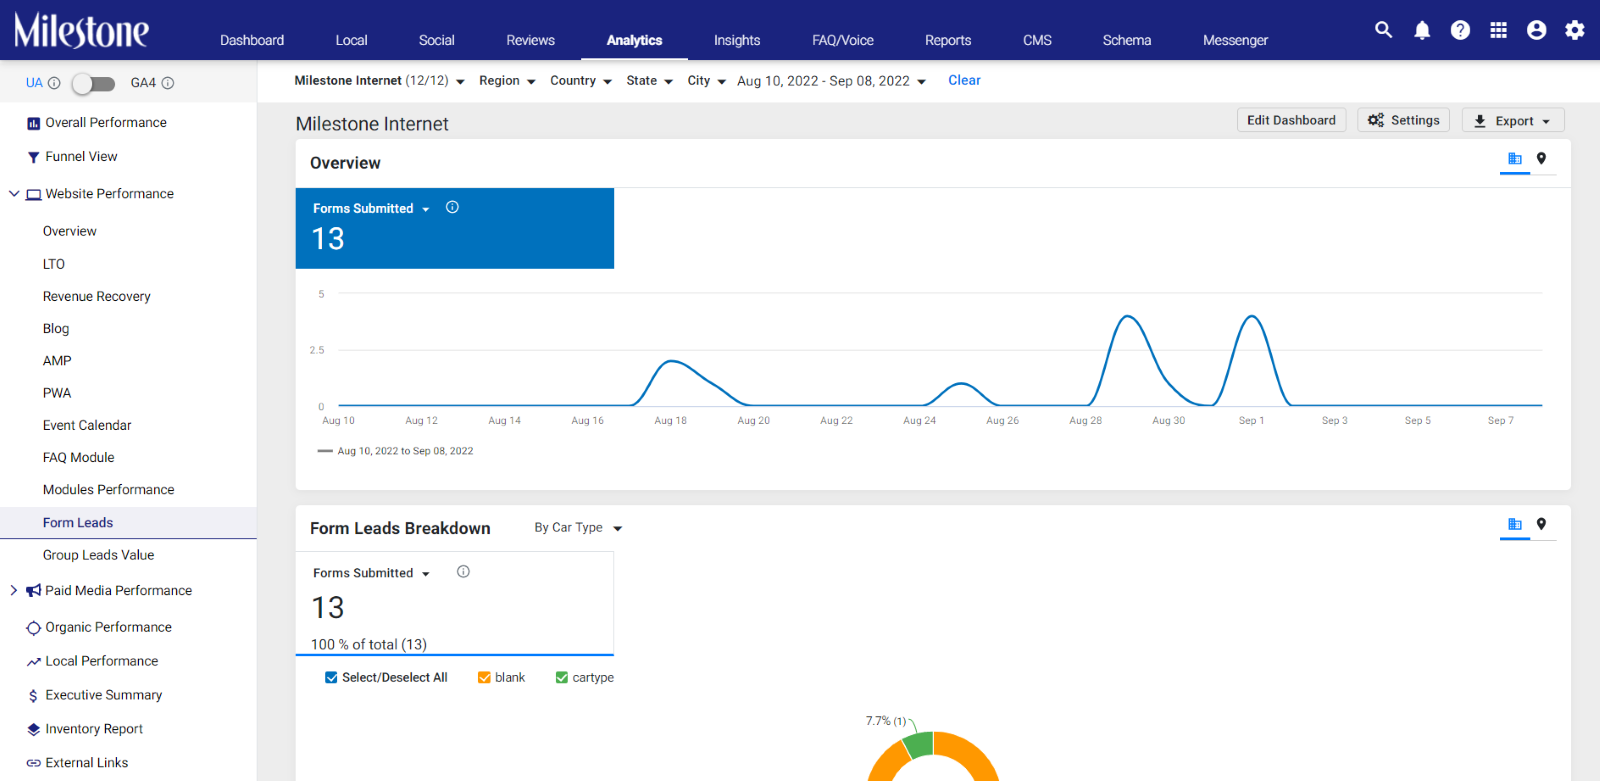
Switching to the location view from the icon to the top right displays form submission data for specific business locations
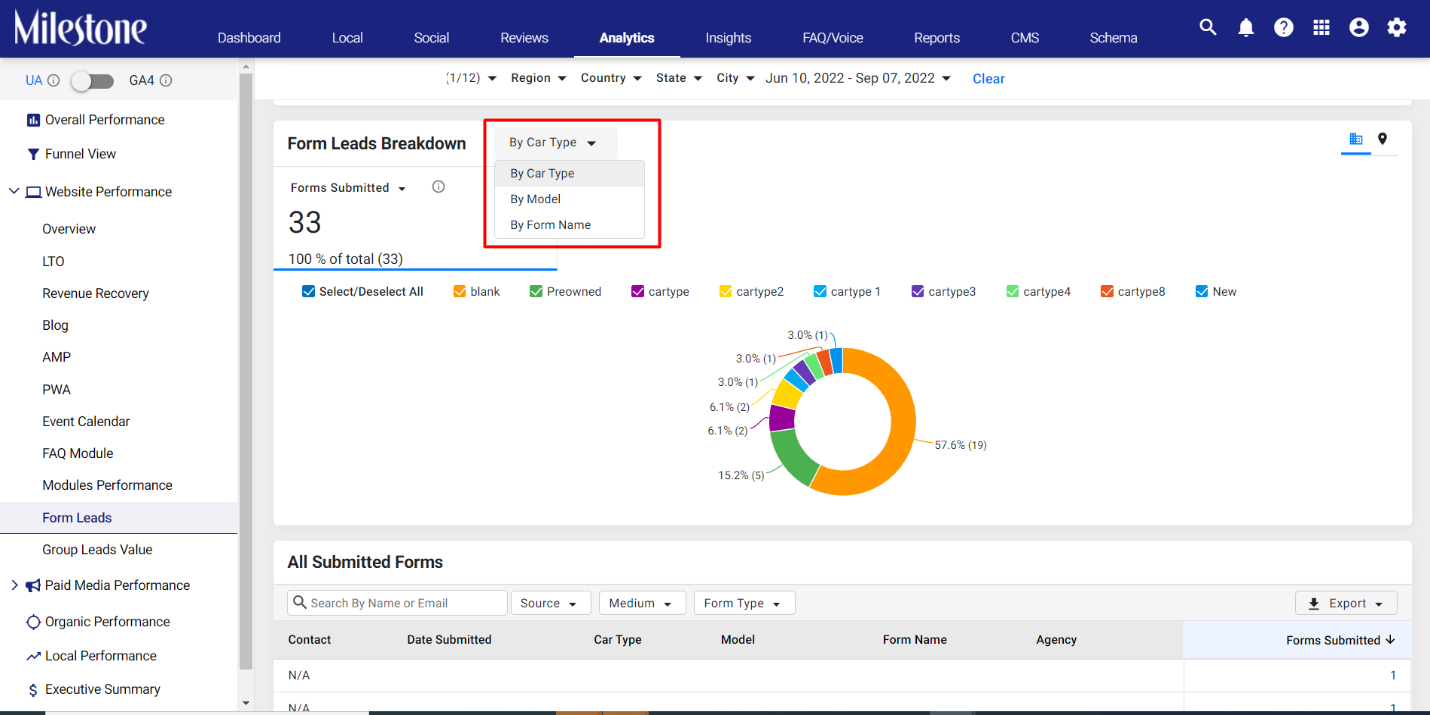
The ‘Form Leads Breakdown’ chart displays the Form Leads you have received for specific products or services
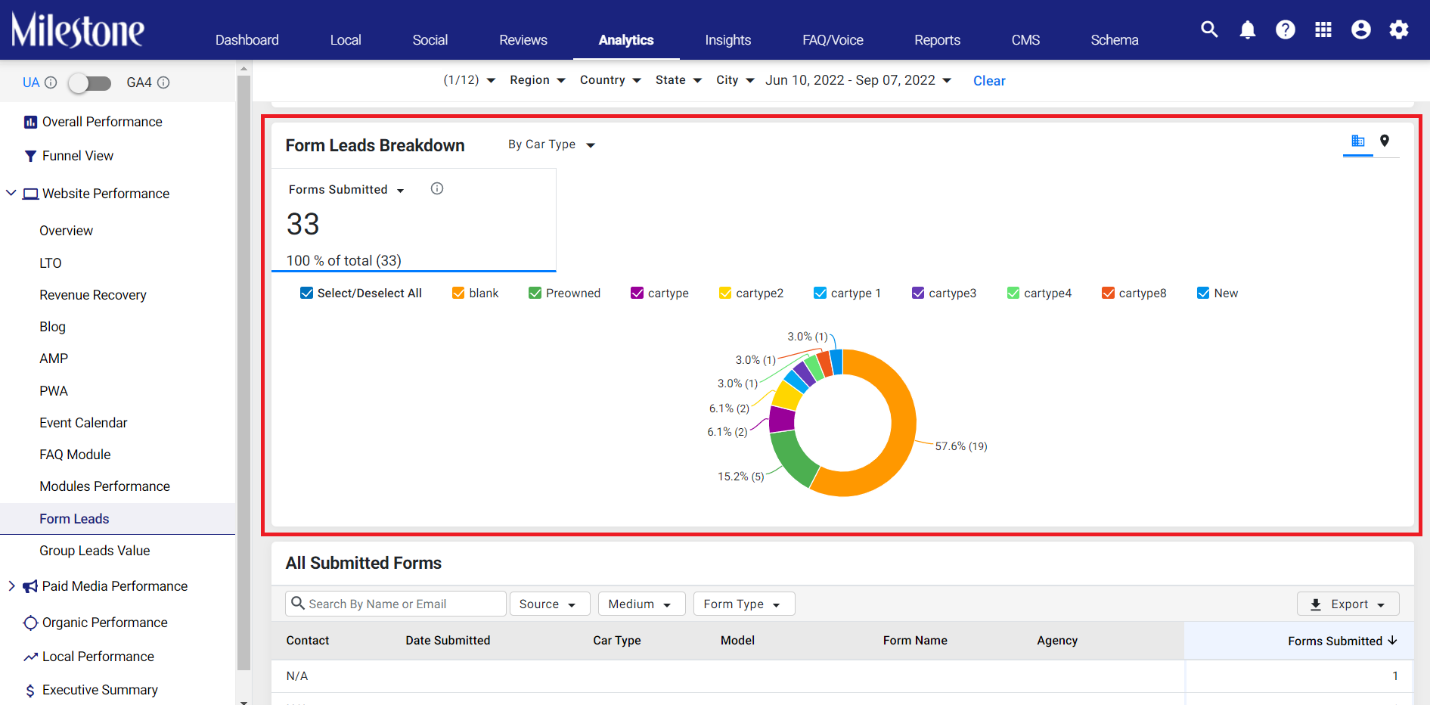
Use the dropdown menu to filter breakdown data for specific products or services. In this example the company is an automotive dealer, therefore, data can be displayed in Form Leads for specific car types, car models, and form names.
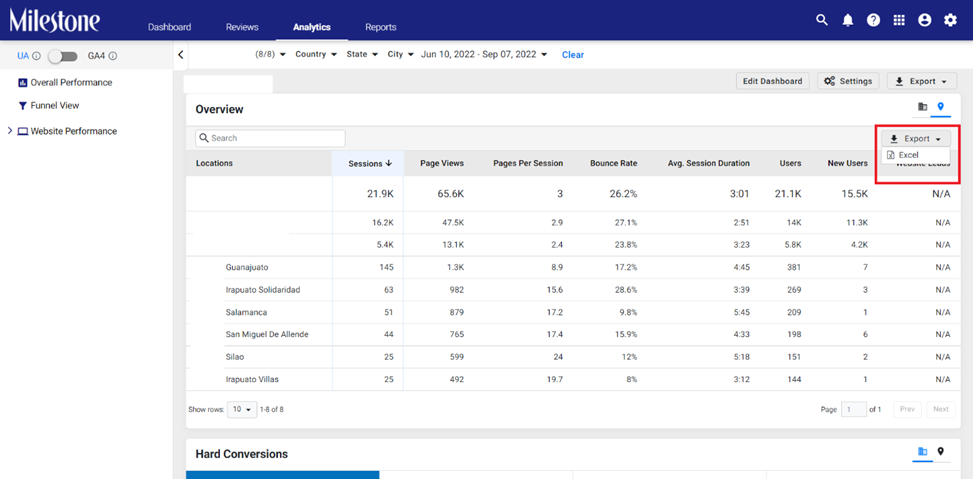
Export Website Performance data to Spreadsheet
Opportunity: Viewing the website performance overview data on a spreadsheet provides a wide spectrum of functionality offered by Excel while allowing for easy redistribution.
Solution: You can now download the website performance overview data to a spreadsheet using the ‘Export’ button.
Path: Milestone Analytics > Website Performance > Overview
Step 1: From the Milestone Analytics page click on ‘Website Performance’ in the left navigation panel
Step 2: Select location view for the data from the top right of the chart
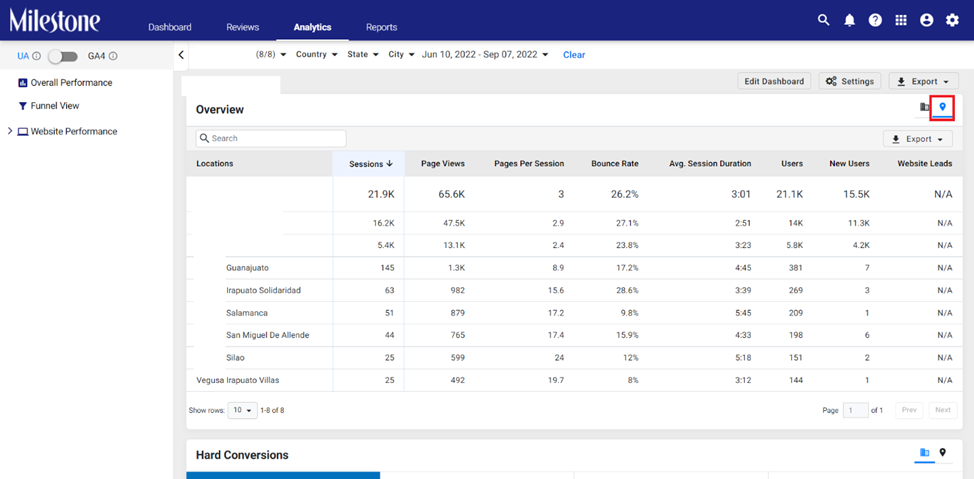
Step 3: Click on ‘Export’ within the widget and click on ‘Excel’ to export data from this widget to a spreadsheet