Release: Dec 7, 2021
Analytics
1. KPIs added to Holiday Banner
Opportunity: 75% of Americans abandon their carts due to a lack of offers or discounts. That’s 75% of customers lost in the final stage of making a purchase, an issue that can be solved by Offers. On Milestone CMS we facilitate the use of holiday banners to drive sales during the holiday season and lure customers to make a purchase rather than choose a competitor. Of course, knowing the performance of each holiday offer is crucial to making strategic decisions in improving the revenue of the business.
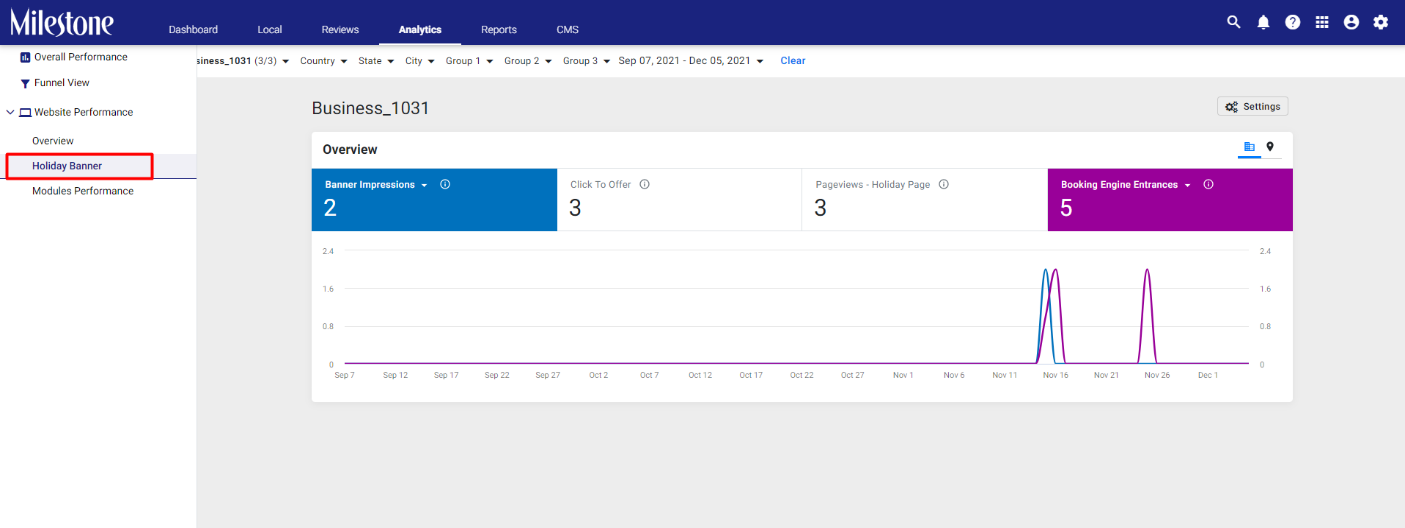
Solution: Milestone Analytics’ Holiday Banner feature allows you to view up to 7 Key Performance Indicators (KPIs) for your Holiday ads. To improve the overall user experience, we made a change by converting the scorecard view to a chart view.
Path: MPC > Analytics > Website Performance > Holiday Banner
Step 1: In the left navigation panel of the Analytics section click on ‘Holiday Banner’ under ‘Website Performance’
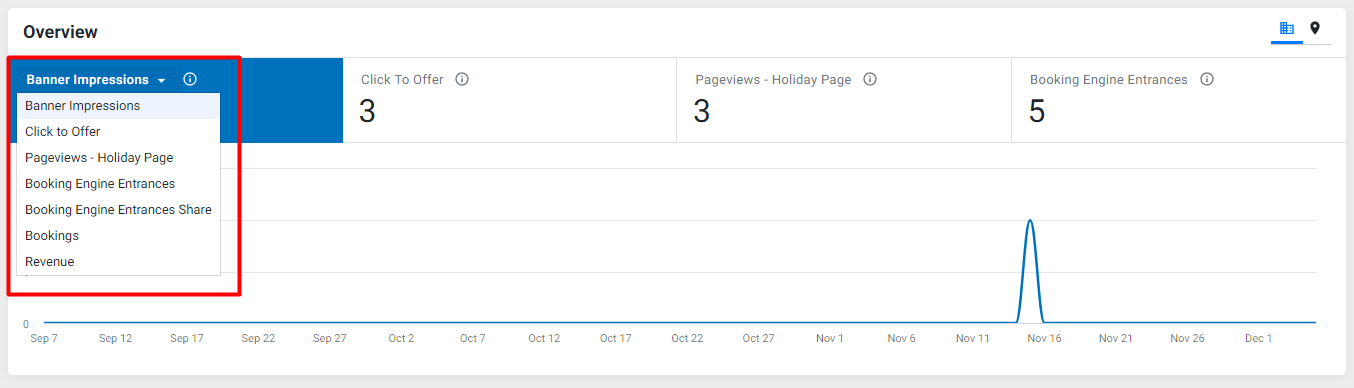
Step 2: Click on the dropdown menu in one of the data tiles and select the KPI you wish to view in the trend graph
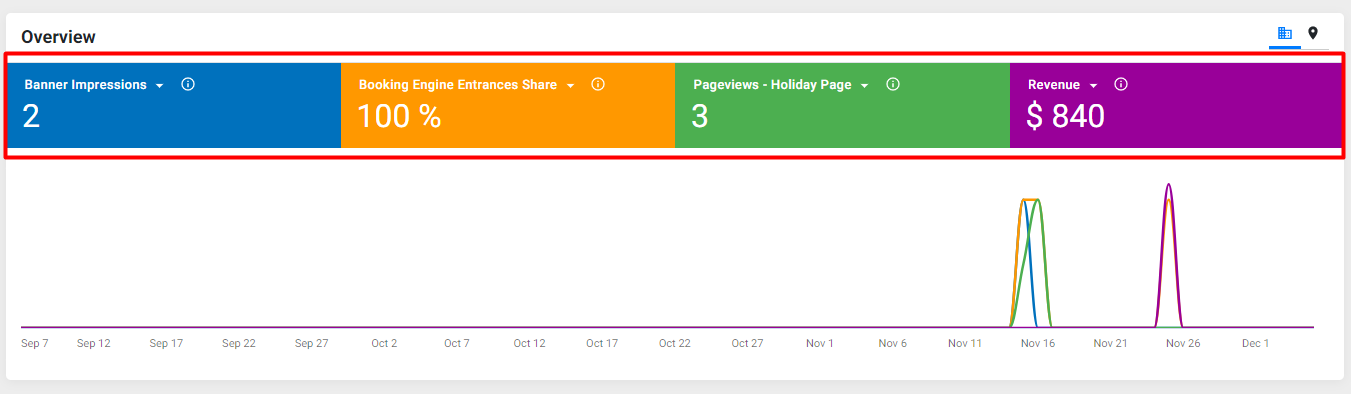
Step 3: You can view multiple KPIs on the same trend graph by selecting or deselecting a data tile
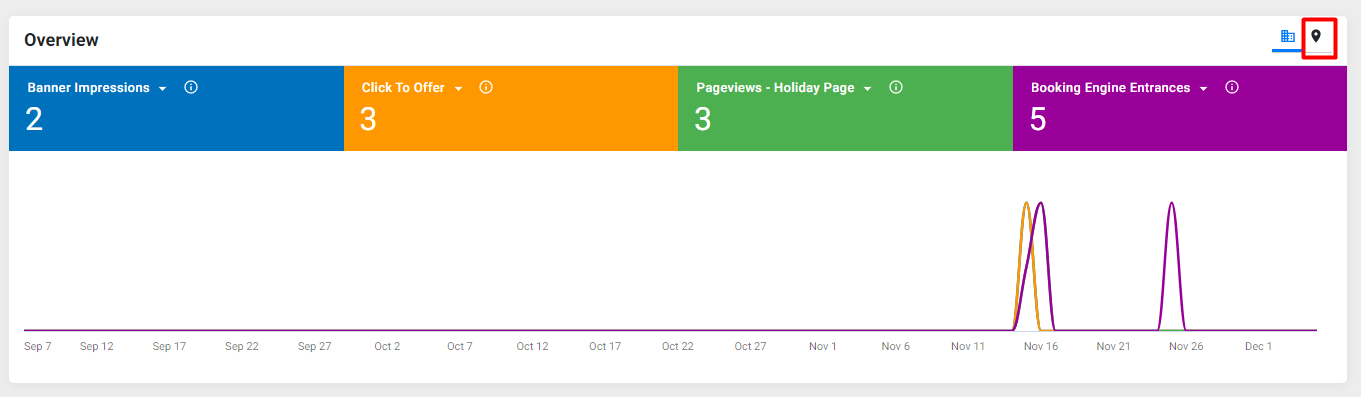
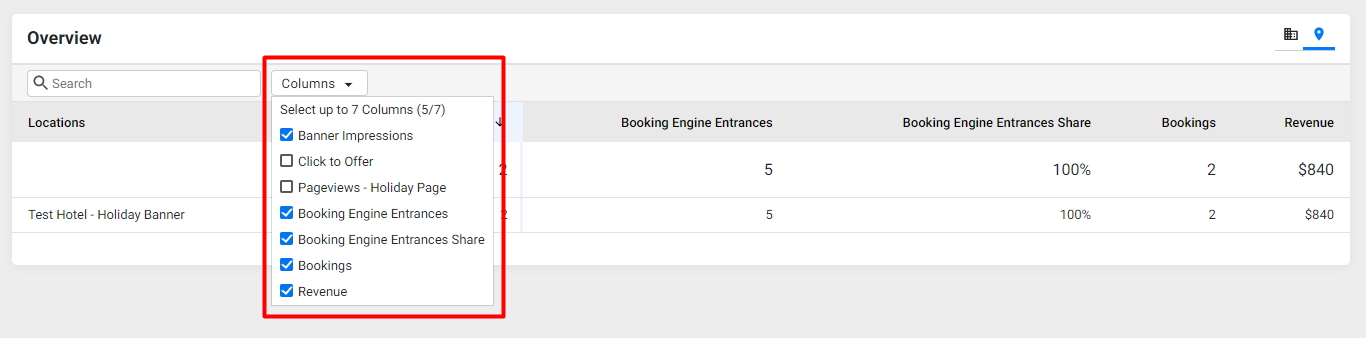
You can also select profile view (tabular data) for Holiday Banners across all locations by clicking on the 'Profile view Icon’ to the top right of the screen
In the 'Profile view, you can select or deselect data columns using the dropdown menu to the right of the search bar
Local
1. Export Facebook Insights to PDF
Opportunity: With Facebook, the leading social media platform, and with over 200 small and medium businesses using Facebook to reach their audiences, knowing how your business is performing on the platform is critical in terms of your brand’s visibility, and as an answer, we created the Facebook Insights tab. You can now view the key metrics of customers engaging with your business on Facebook and can even download a consolidated report for the selected date range.
Solution: Now export your Facebook Insights to a PDF document for easy sharing and reuse. Export multilocation data to Excel and view tabular data across locations on a spreadsheet.
Path: MPC Dashboard > Local > Facebook Insights
Step 1: In the Local section go to ‘Facebook Insights’ in the left navigation panel

Step 2: Click on the ‘Export’ dropdown to the top right of the screen

To download visual data for Facebook Insights click on PDF

The widgets will be downloaded in PDF format for reuse

For tabular data select ‘Excel’

The data will be displayed on a spreadsheet of easy reuse

FAQ/Voice
1. GSC Sourced FAQs
Opportunity: With search engines picking out conversational content, the first step towards addressing queries online is to understand the questions people are asking online. To help your business stay relevant on search and show up as rich results for a particular query, we’ve introduced Google Search Console which will give you a clear picture of what your business needs to be addressing.
Solution: Milestone’s FAQ Manager now allows you to source questions from Google Search Console to provide you with relevant questions that users are asking.
Path: MPC Dashboard > FAQ/Voice > Q&A
Step 1: Click on Q&A in the left navigation panel of the FAQ/Voice section

Step 2: Scroll down to the sourced FAQs section below the graph and click on the ‘Filters’ icon

Step 3: From the ‘Source’ filter dropdown menu you can now select ‘Google Search Console’

Insights
1. Export competitive summary for business with multiple locations
Opportunity: With the recently launched Competitive Summary section you can deep dive into the key SEO parameters of your website against your competition and know where you edge out your competition and where you need to catch up to give you a holistic picture of what your website needs to take care of to be visible on search.
Solution: Now you can export a single PDF report that contains data for multiple business locations for easy sharing and interpretation.
Path: MPC Dashboard > Insights > Competitive Summary
Step 1: Select the profile to be included in the report

Step 2: Click on the ‘Export’ dropdown menu and click on PDF

Step 3: The PDF report will contain data for each business location individually

2. Export Competitive Summary for Individual Profiles
Opportunity: With the recently launched Competitive Summary section you can deep dive into the key SEO parameters of your website against your competition and know where you edge out your competition and where you need to catch up to give you a holistic picture of what your website needs to take care of to be visible on search.
Solution: Milestone Insights allows you to view and generate competitive performance reports for individual business locations using the ‘Export’ function. Reports are generated in PDF format for easy viewing and resharing.
Path: MPC Dashboard > Insights > Competitive Summary
Step 1: Click on ‘Competitive Summary’ in the left navigation panel of the ‘Insights’ section

Step 2: Select the location for which the report needs to be generated from the dropdown menu

You can also select the profile from the menu in the ‘Competitive Summary’ section

Click on ‘Export’ to the top right of the screen from the ‘Competitive Summary’ section of the individual business location

The generated PDF report will contain data related to website performance against that of competitors
