Performance Summary Overview
The Schema Performance tab will give your business key insights into the performance of your web pages, rich results, and schema categories for the date range selected.
Path: Milestone Schema Manager > Performance Summary

At the top of the Performance Summary you will see 4 data tiles displaying;
- Total Impressions: The number of times a webpage or ad was displayed to users in search results.
- Total Clicks: The number of times users clicked on a webpage or ad after it appeared in search results.
- Potential Cost Savings: The estimated reduction in expenses by deploying structured data (schema) on your web pages.
- Total Universal Results: The number of rich search results (e.g., images, videos, maps) displayed alongside organic listings.

On the Seach Performance screen, you can select between viewing the performance of your webpage for 'All Results', 'Rich Results', 'Categories', and 'Potential Cost Savings'.

1. All Results
On the ‘All Results’ screen, you will see the search performance of your web pages in terms of 'Total Impressions', 'Total Clicks', 'Average CTR', and 'Average Position' for the date range selected. Click on the scorecard tile of any of the KPIs to view its performance on the trend graph.

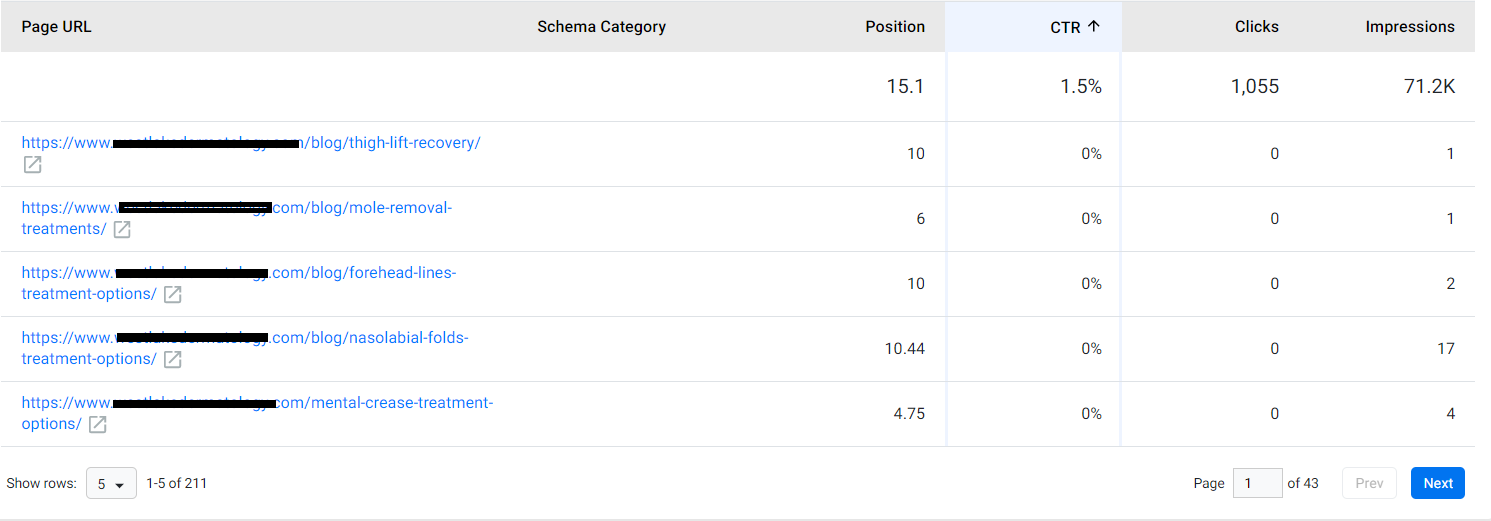
You will also see the breakdown of search performance for each URL that has a published schema.
Using the ‘Columns’ filter you can choose the KPIs you wish to see.
2. Rich Results
By choosing ‘Rich Results’ you will see the search performance of your rich results in terms of total impressions, clicks, average CTR, and average Position on search. Click on the scorecard tile of any of the KPIs to view its performance on the trend graph.

Here too, the page will display the rich result performance for each URL with published schema.
3. Categories
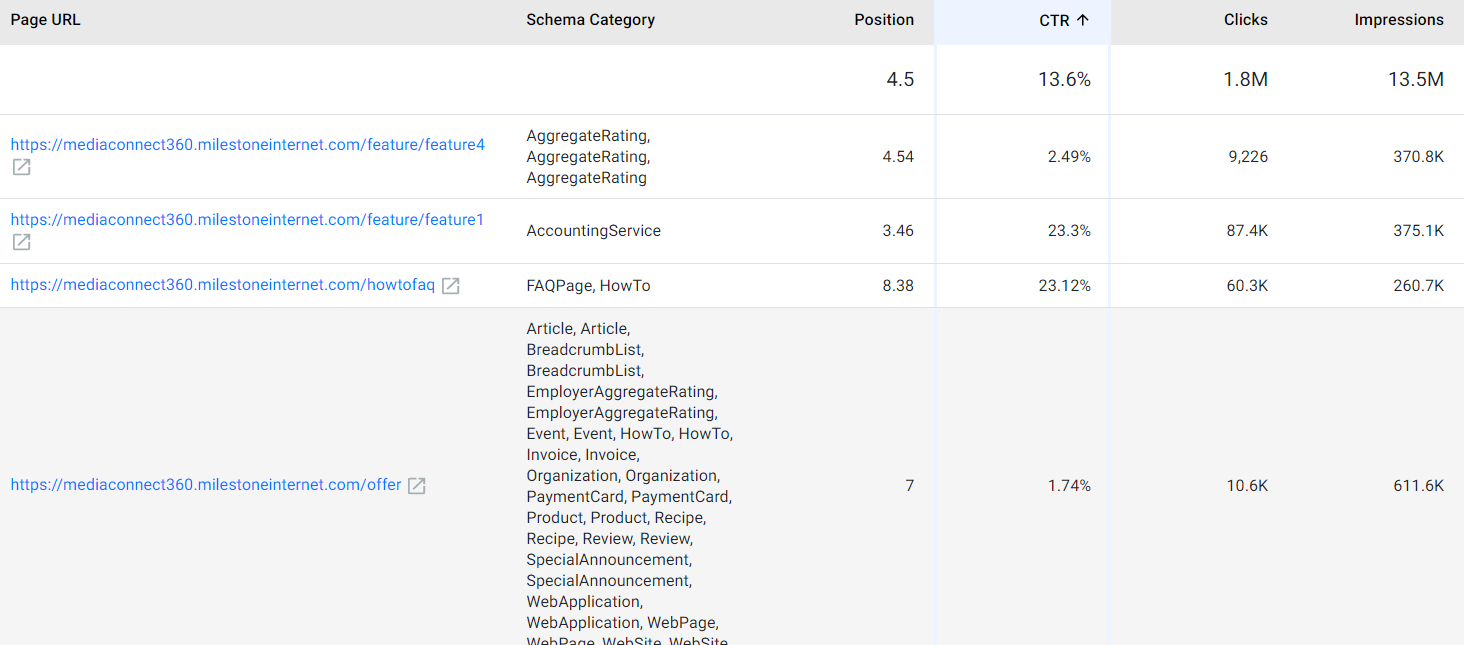
This displays the performance of the schema categories or combinations. Using this data, you’ll know exactly which schema combinations are working for your web pages and which are not. You will see key KPIs such as Position on search, CTR, URL Clicks, and URL Impressions.

Click on ‘Export Excel’ to download a copy of the data.

4. Potential Cost Savings
The 'Potential Cost Savings' tab allows you to see the amount of cost savings generated by deploying schema to your webpage. This tab shows the percentage increase or decrease in 'Total Impressions' and 'Total Clicks', with the 'Potential Cost Savings' in Dollars.

For the date period selected, you will also see the total universal search results (basically how and where your web content appeared on search). You will also see the data for each universal search independently. Click on any of the universal search results to view its performance on the trend graph.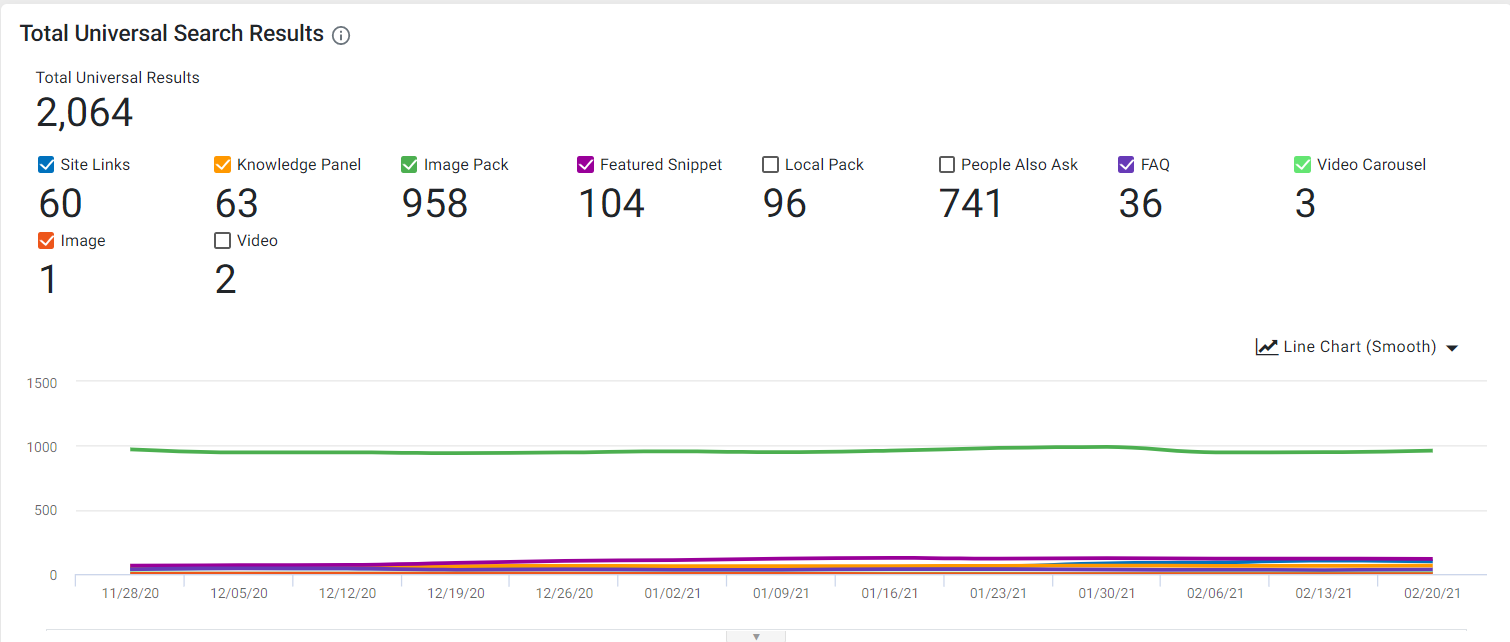
5. Filters
Use the 'Filter' dropdown menu to add filters to the results.
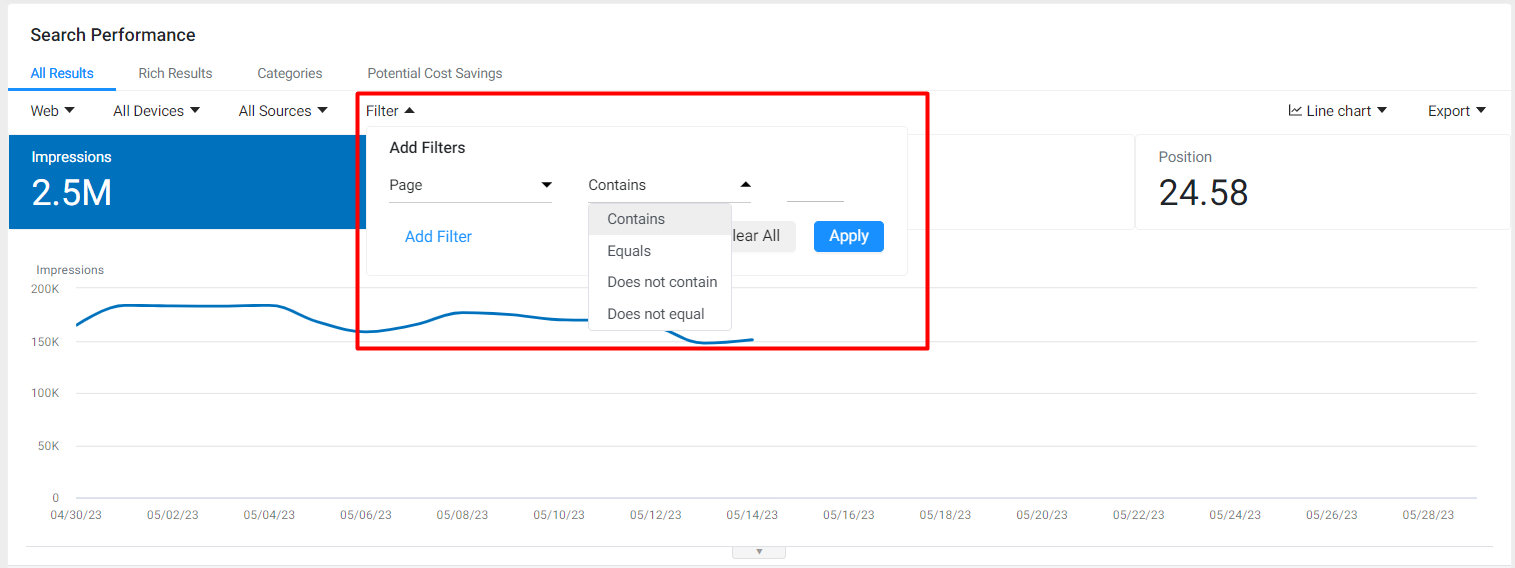
You can add multiple filters to the widget by clicking on 'Add Filter' in the filter dropdown menu.

Important Note: If you apply 'Page' filters you might see an increase in Clicks and Impressions data. This is because these filters cause your data to be aggregated (grouped) by page rather than by property.
Aggregated by page means that each unique URL in a search result is counted once, even if they point to the same page. In this case, if a query contains two URLs from the same site (example.com/petstore/giraffe and example.com/recipes/pumpkin_pie), this is counted as two impressions.
6. Difference between Schema Performance Summary and Google Search Console
Milestone Schema Manager ensures that the performance data of businesses implementing schema is consolidated on one screen. While we fetch data from Google Search Console, the data offered by Schema Performance Summary goes beyond the limitations of GSC in terms of:
- Number of queries that can be fetched at a time
- Amount of data that can be retrieved
-
Viewing performance – performance linked to a URL, overall view of search appearance types, viewing the performance of schema categories, and potential cost savings insight which is not available on GSC.
|
Comparison Metric |
Google Search Console |
Schema Performance Summary |
|
Limitation |
Only 1000 rows of query/URL in export |
Entire dataset including all the URLs available in export |
|
Retention |
16 months of data from the current date |
16 months of data prior to the setup. All the data to date post setup |
|
Useful Views |
No way to filter performance data for URLs to which schema was applied from Schema Manager |
An additional dimension to view the performance data for only the URLs which are in scope for schema deployment |
|
Search Appearance types have individual views |
Unified view of all Search Appearance types in addition to the individual views |
|
|
Data for page and query are separated |
Easy to view the queries related to a URL |
|
|
No Schema to URL mapping |
URL to Schema mapping: Associated views help to you know which schema combinations are performing well |
|
|
N/A |
Potential Cost Savings gives you an idea about the potential dollar value saved by deploying Schema |
