Google Ads – Paid Media Reporting Overview
Businesses can now analyze the performance of their paid media campaigns on the Paid Media Reporting section on MPC.
Once on MPC click on ‘Reports > Click on the Analytics drop-down > Click on Paid Media Reports – Revenue or Paid Media Reports – Leads.
Currently, the Paid Media Reporting covers 2 types of clients:
Revenue clients: Shows conversion metrics like Revenue, Bookings, ROAS, CPA (Bookings)
Leads clients: Shows conversion metrics like Leads, CPA (Leads)
MPC > Reports > Analytics > Paid Media Revenue or Leads
Source: Google Ads (based on Paid channels attribution only)
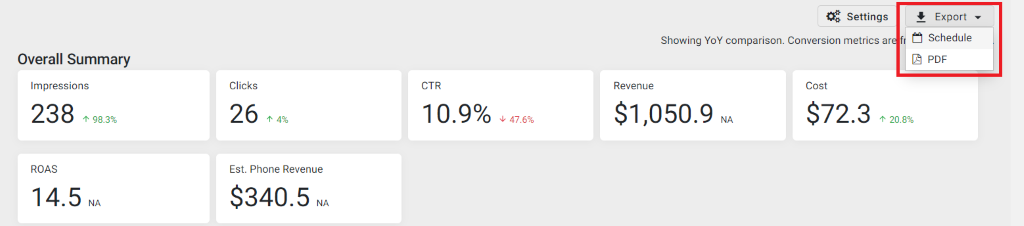
Business can analyze their performance on the MPC UI or choose to download a PDF Report and carry out the following functions:
Schedule Report for One-time and Monthly basis for single or multiple users.
Click on ‘Export’ and choose ‘Schedule’.
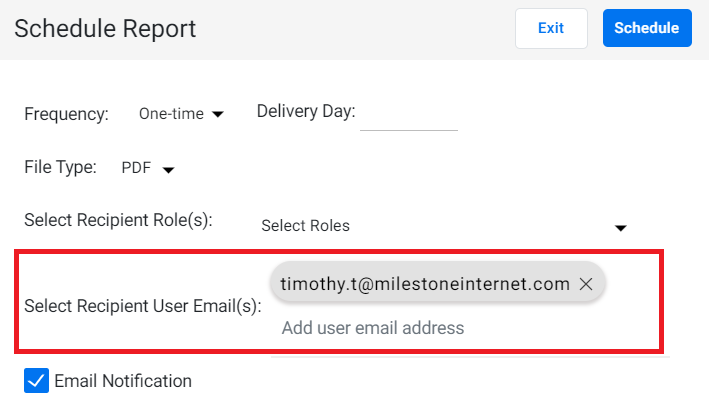
Choose ‘One-time’ or ‘Monthly’. Then choose the date, file type (PDF), and click on ‘Schedule’.
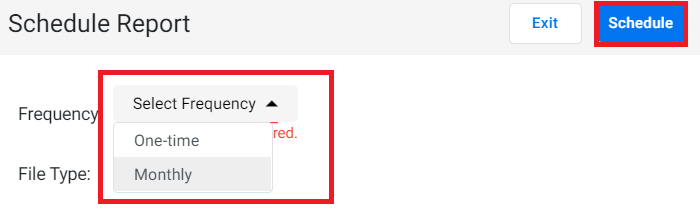
Note: One time and monthly report will always show data for the previous month.
Access reports from Reporting summary or Email notifications.
Businesses can look at their reports either on the Reporting Summary or enter their email ID to receive the one-time or monthly reports.
Generate PDF or check in UI preview for a single profile at a time
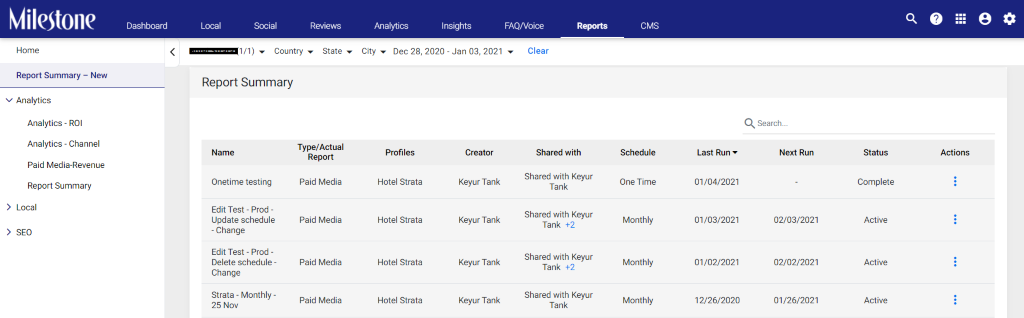
Navigate to the ‘Report Summary’ tab and choose a report you wish to download in PDF format. Click on the ‘Actions’ button to download a PDF report. You can also click on the report to view the performance on the UI.
Section/Widgets of the Paid Media Reporting – Revenue and Leads
Overall Summary:
Score Cards (Major KPIs)
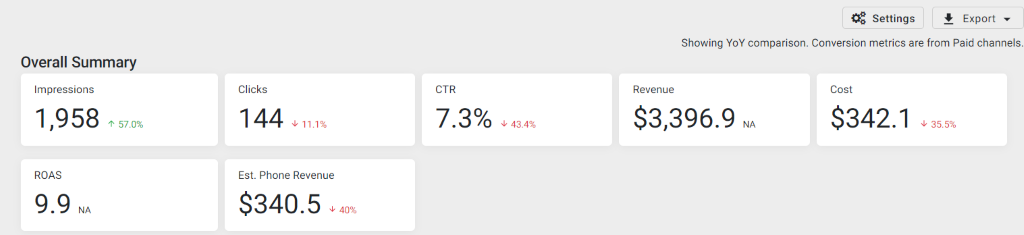
Paid Media Revenue Reporting:
The report will display key revenue KPIs such as impressions, clicks, click-through rate (CTR), Revenue, Cost, Rate of Advertisement Spend, and Estimated Phone Revenue.
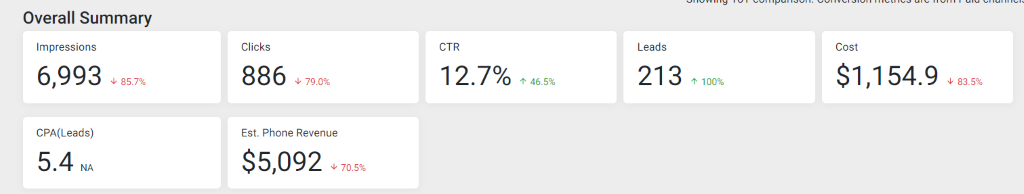
Paid Media Leads Reporting:
The Overall Summary in the Paid Media Leads Reporting will display key KPIs such as impressions, clicks, CTR, leads, Cost of the campaign, Cost per Action (CPA), and Estimated Phone Revenue.
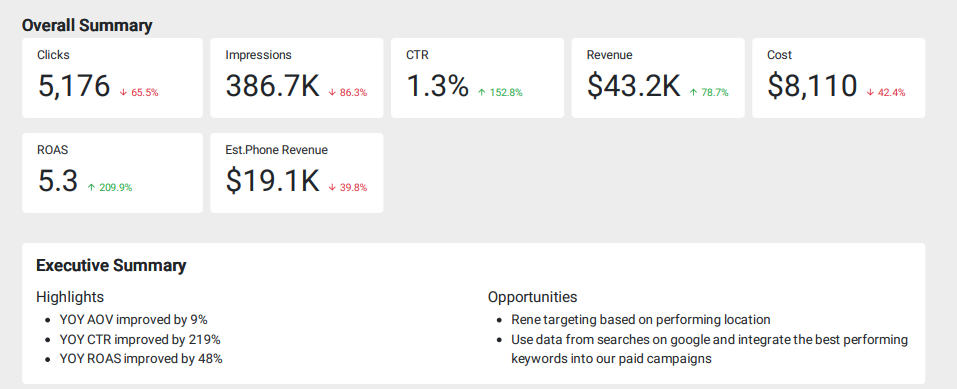
Executive Summary
Displays the Highlights and Opportunities for each business profile for a certain time frame (monthly or quarterly). Users can add summary from MPC Analytics > Executive Summary to show in reporting PDF and UI.
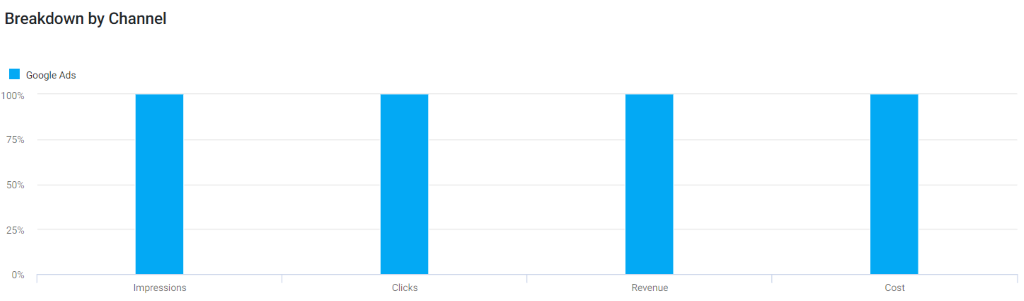
Breakdown by Channel (Bar chart)
Shows Paid channel contribution in percentage for different KPIs in a stacked bar chart.
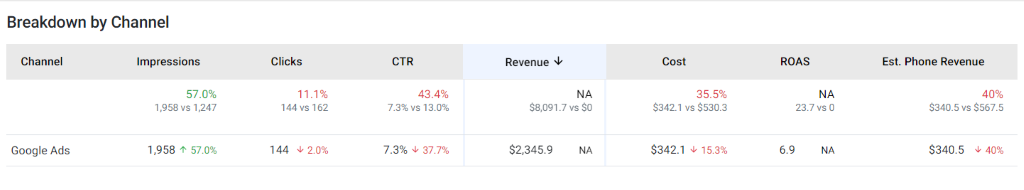
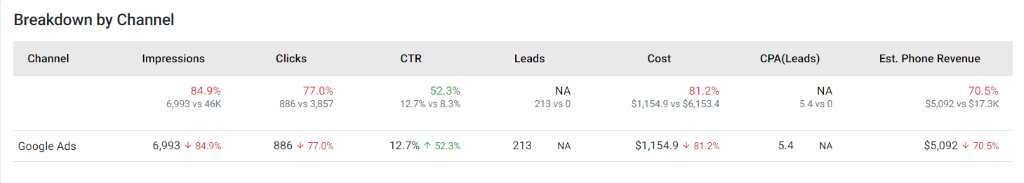
Breakdown by Channel (Table)
Shows Paid channel contribution for different KPIs in the table.
Paid Media Revenue Reporting:
Paid Media Leads Reporting:
Paid Search Google Reporting:
Displays the key Google Ads KPIs and performance metrics for the period selected.
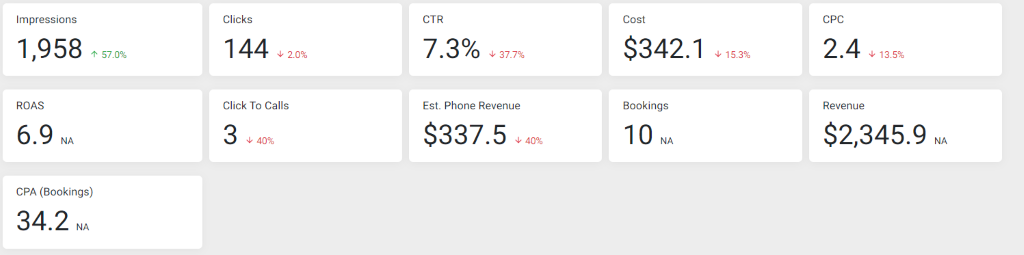
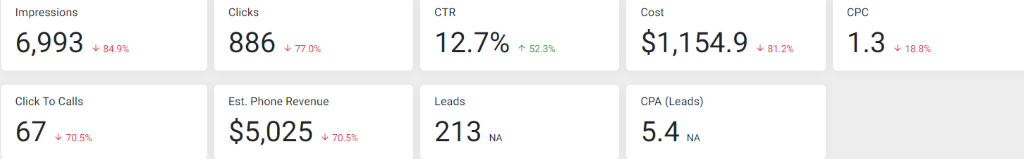
Score Cards (Major KPIs)
Paid Media Revenue Reporting:
Displays major revenue KPIs such as performance, clicks, CTR, Cost, CPC, Rate of Advertisement Spend, Click to calls, Estimated Phone Revenue, Bookings, Revenue, and Cost Per Action.
Paid Media Leads Reporting:
Displays major KPIs such as impressions, clicks, CTR, Cost, CPC, click to calls, Estimate Phone Revenue, Leads, and Cost per Action (CPA).
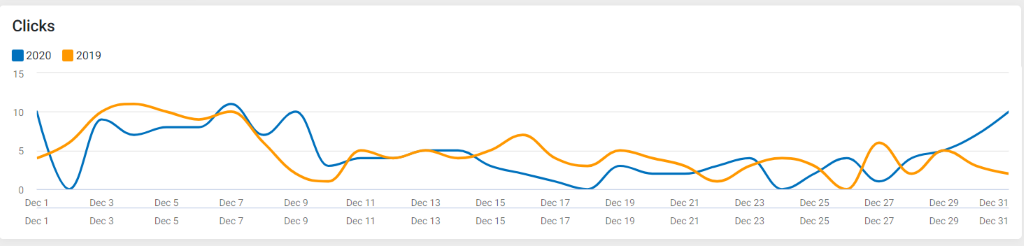
Website Clicks
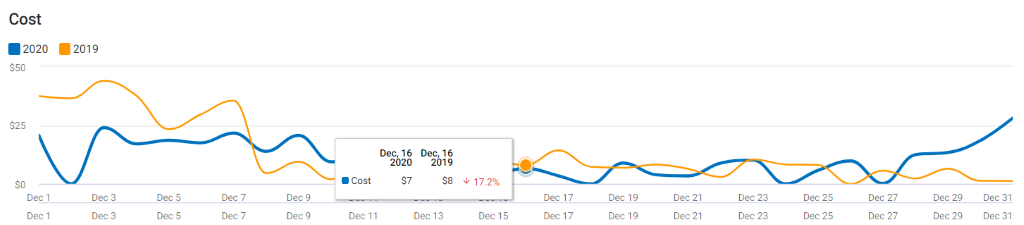
Website Cost
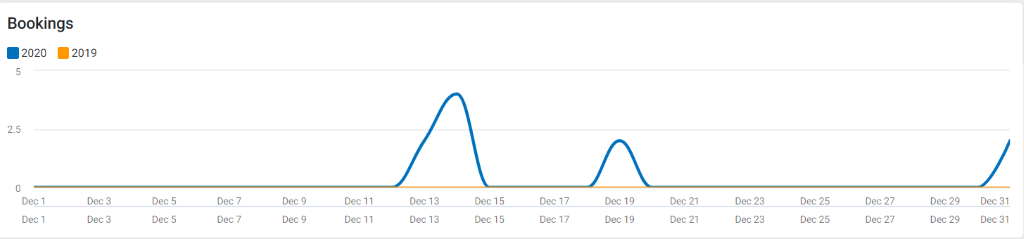
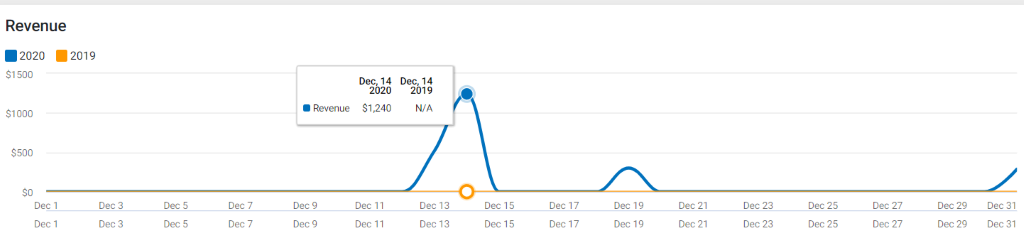
Website Bookings (Line Chart)
Website Revenue (Line Chart)
Revenue by Device (Pie Chart)
Shows contribution of Revenue for different device types

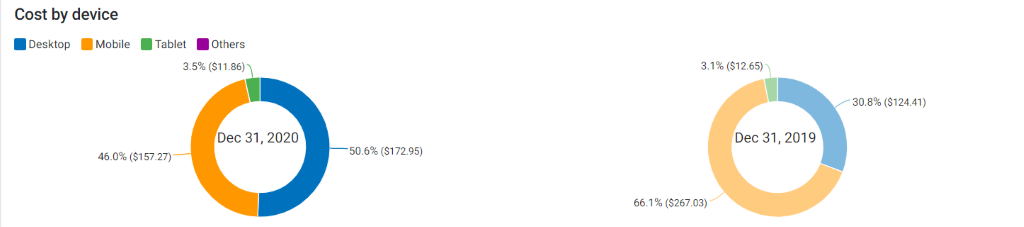
Cost by Device (Pie Chart)
Shows contribution of Cost for different device types
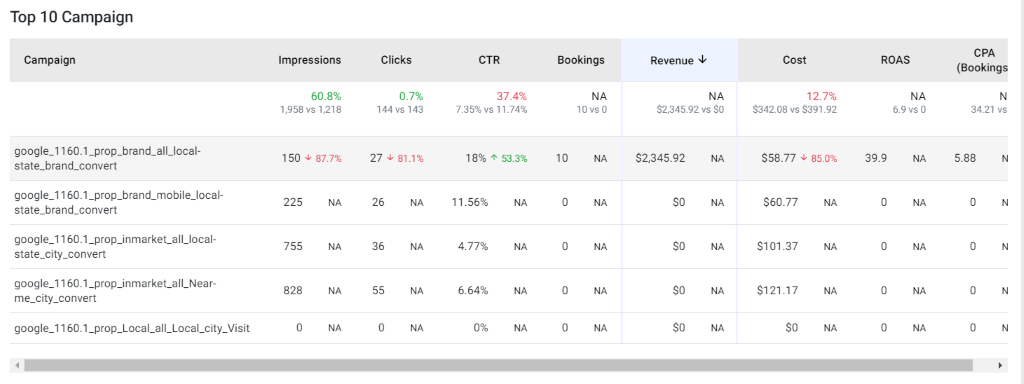
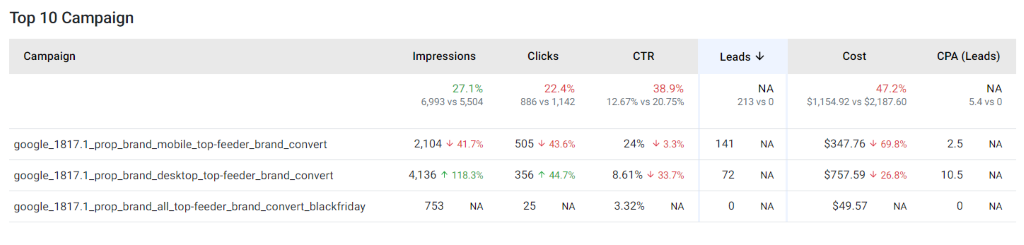
Top 10 Campaign (Top 10 records in Table)
Shows top 10 campaign performance sorted by Revenue
Shows top 10 campaign performance sorted by Leads
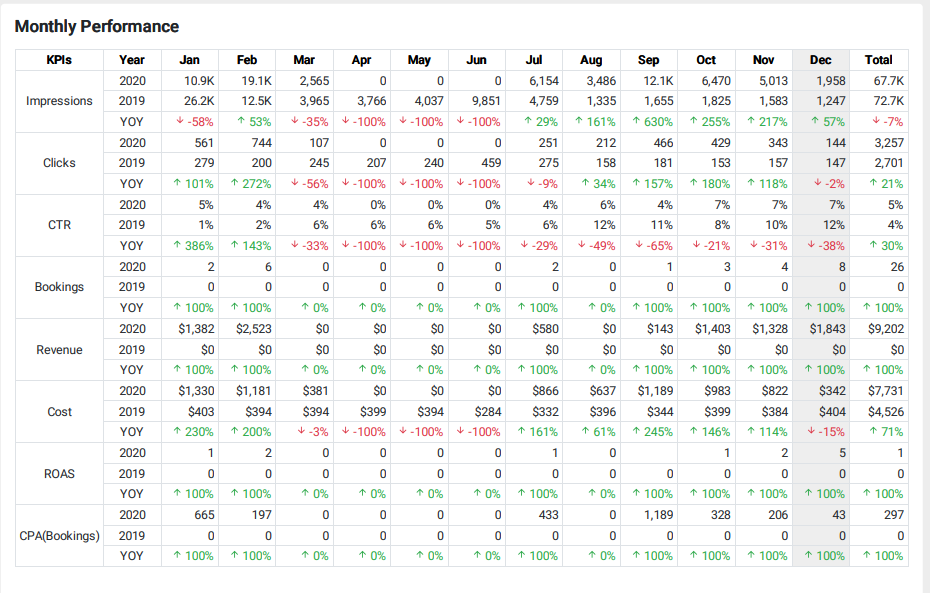
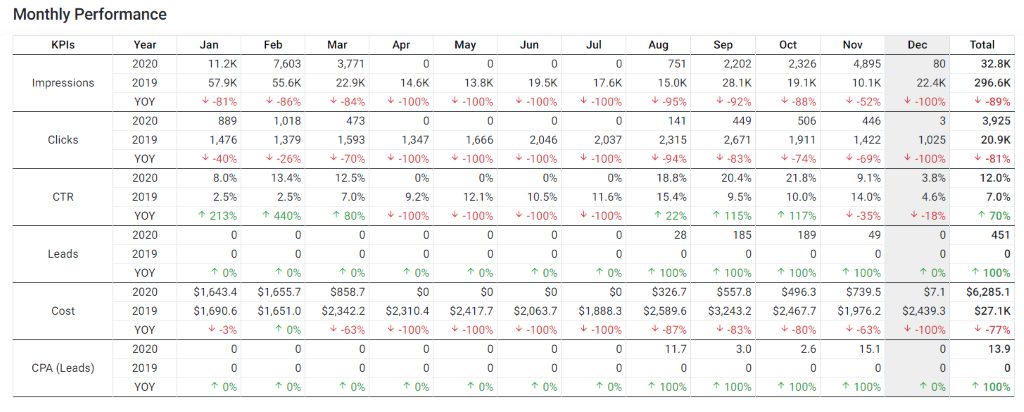
Monthly Performance (Table)
Shows monthly performance for different KPIs with YoY comparison and Total for Paid Media Revenue
Shows monthly performance for different KPIs with YoY comparison and Total for Paid Media Leads
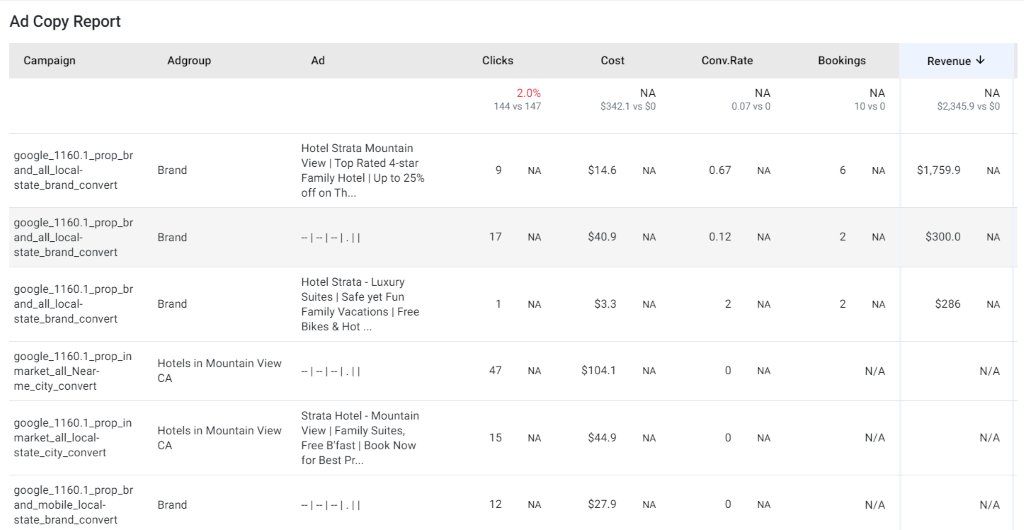
Ad Copy Report (Top 10 records in Table)
Shows top 10 Ads performance for different KPIs sorted by 1. Revenue and Clicks (in case revenue is 0, the report is sorted based on clicks)